1. Selecting the period
At the top of the section you can select the period for the Sales funnel: week, month, quarter, year, or a custom date range. After changing the period all charts update automatically.
2. Stages of the Sales funnel
If Leads get stuck at some stage, the process slows down and some potential clients are lost. The report reflects the distribution of deals across work stages. Each bar shows a funnel stage and the number of Leads on it. Example stages:
- «Не обработан» — a Lead has just arrived and has not yet been processed by a manager;
- «Оформление договора» — the Lead is being worked on, negotiations are underway, documents are being prepared;
- «Сделка провалена» — the client refused or the deal did not result in a sale.
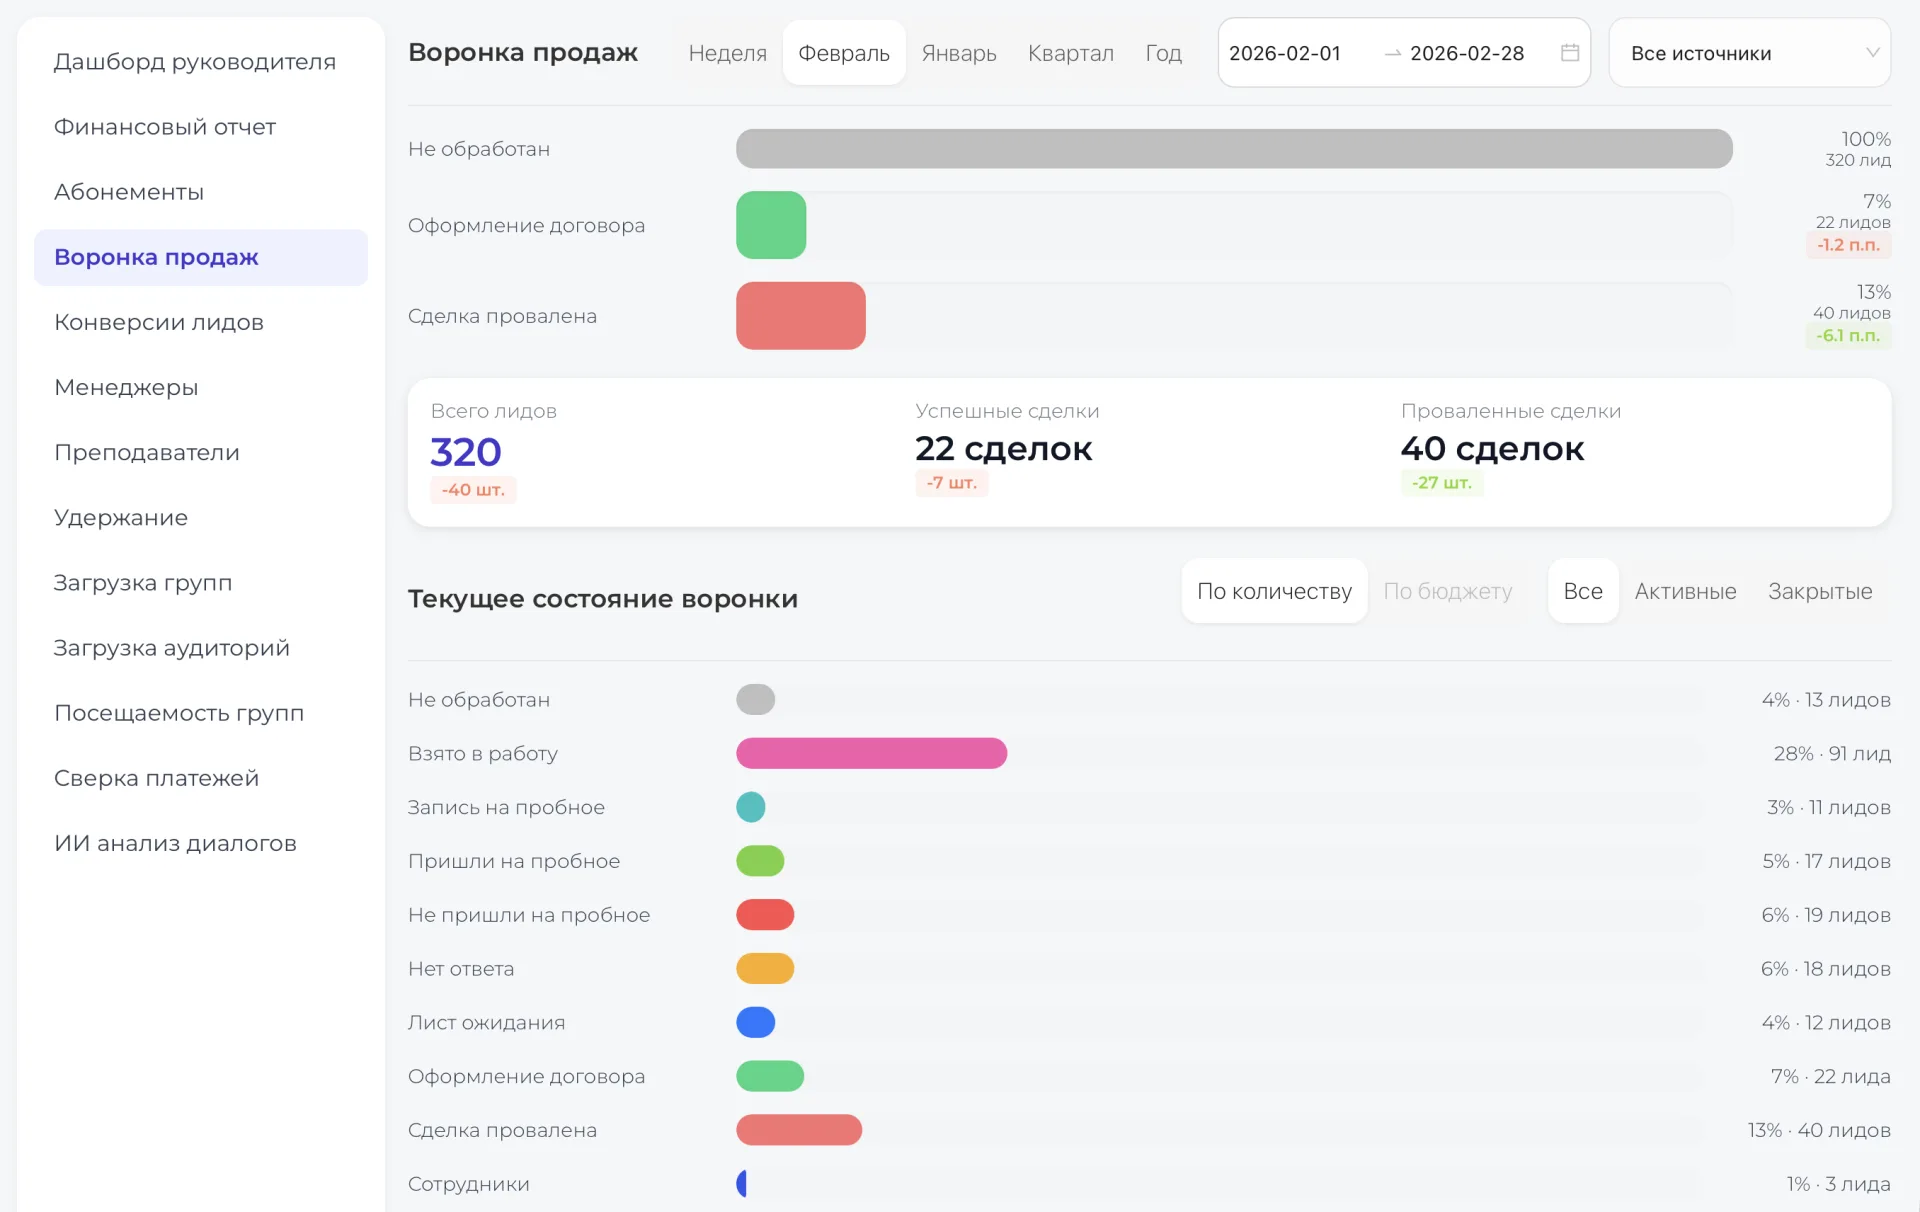
The width of the bar depends on the number of Leads at the stage: the more Leads, the wider the display.
The chart lets you quickly assess the distribution of Leads by stage and understand where delays or client losses occur.
- If there are many Leads at the «Не обработан» stage — the problem is response speed.
- If a large number are at intermediate stages — deals are dragging on.
- If the number of «Сделка провалена» is growing — there may be errors in qualification or in managers’ work.
The data helps you clearly see where deals are getting delayed.
3. Overall statistics of Leads and deals
Without understanding the overall flow of Leads and conversion it is difficult to identify weak points in the funnel.
- Lead — a potential client who submitted an inquiry or showed interest.
- Deal — the process of working with a client that may end in a sale or a refusal.
This block shows:
- How many Leads arrived during the selected period;
- How many resulted in a deal;
- How many failed.
If there are many failed deals, it means there are problems at some stage of the funnel. Analyzing the dynamics of successful and failed deals reveals where the process works and where it does not.
4. Current state of the funnel

The analytics display two key performance parameters of the sales department:
- Average deal duration — the average number of days from Lead creation to deal closure.
- Number of open deals — Leads that are still in progress.
Metrics are shown as numbers, for example:
- 8 d. — average deal duration from Lead to signed contract.
- 280 pcs. — the number of active deals in the Sales funnel.
Values are calculated automatically based on data for the selected period. On the right side of the screen you can filter by active or closed positions. If deals close slowly, this is a signal that the process is stalling. Many open deals indicate manager overload.
With this data it is easier to organize work and tasks, speeding up the process and retaining clients.