Main blocks:
- Access to the section
- Period
- Key metrics
- Chart of expense and revenue by days
- Sales funnel by sources (Воронка по источникам)
- Leads by sources
- Report on Meta Ads
- How to read the metrics
1. Access to the section
The "Marketing" section is located in Analytics (Аналитике) and works based on data from the Meta Ads ad account. Metrics and tables are filled only after the connection to Meta Ads is completed in the integrations settings. If the connection is absent, the section remains accessible but without displayed data.
2. Period
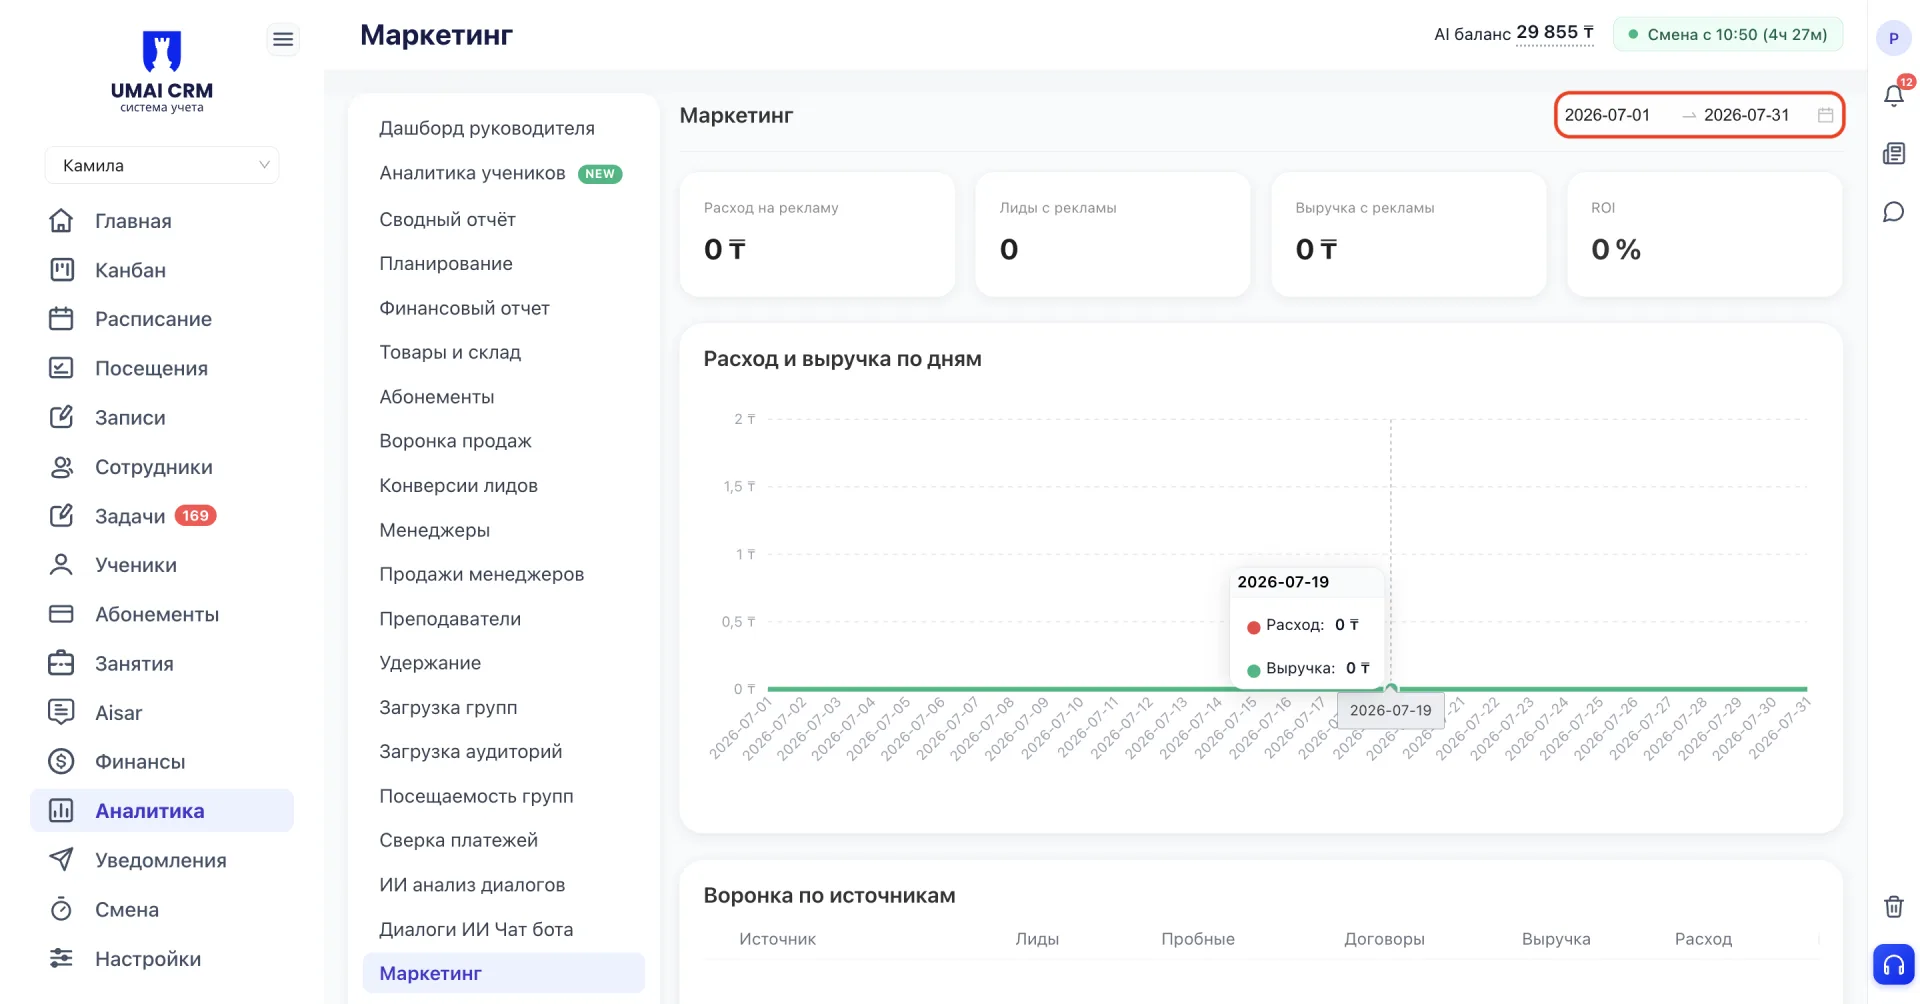
The date range is set in the upper right corner. All blocks on the page depend on the selected period: metric cards, chart, sales funnel by sources (Воронка по источникам) and the advertising report. If you change the period, all data on the page will be recalculated simultaneously.
3. Key metrics
At the top of the page there are four cards with the main figures for the selected period:
Advertising expense — the amount spent on all advertising campaigns. Since Meta Ads charges the budget in dollars, the amount in tenge is supplemented with the expense in the original currency and the exchange rate used for conversion. This is necessary to avoid confusion if the rate changed during the period.
Leads from ads (Лиды с рекламы) — the number of inquiries that the system associated with advertising campaigns.
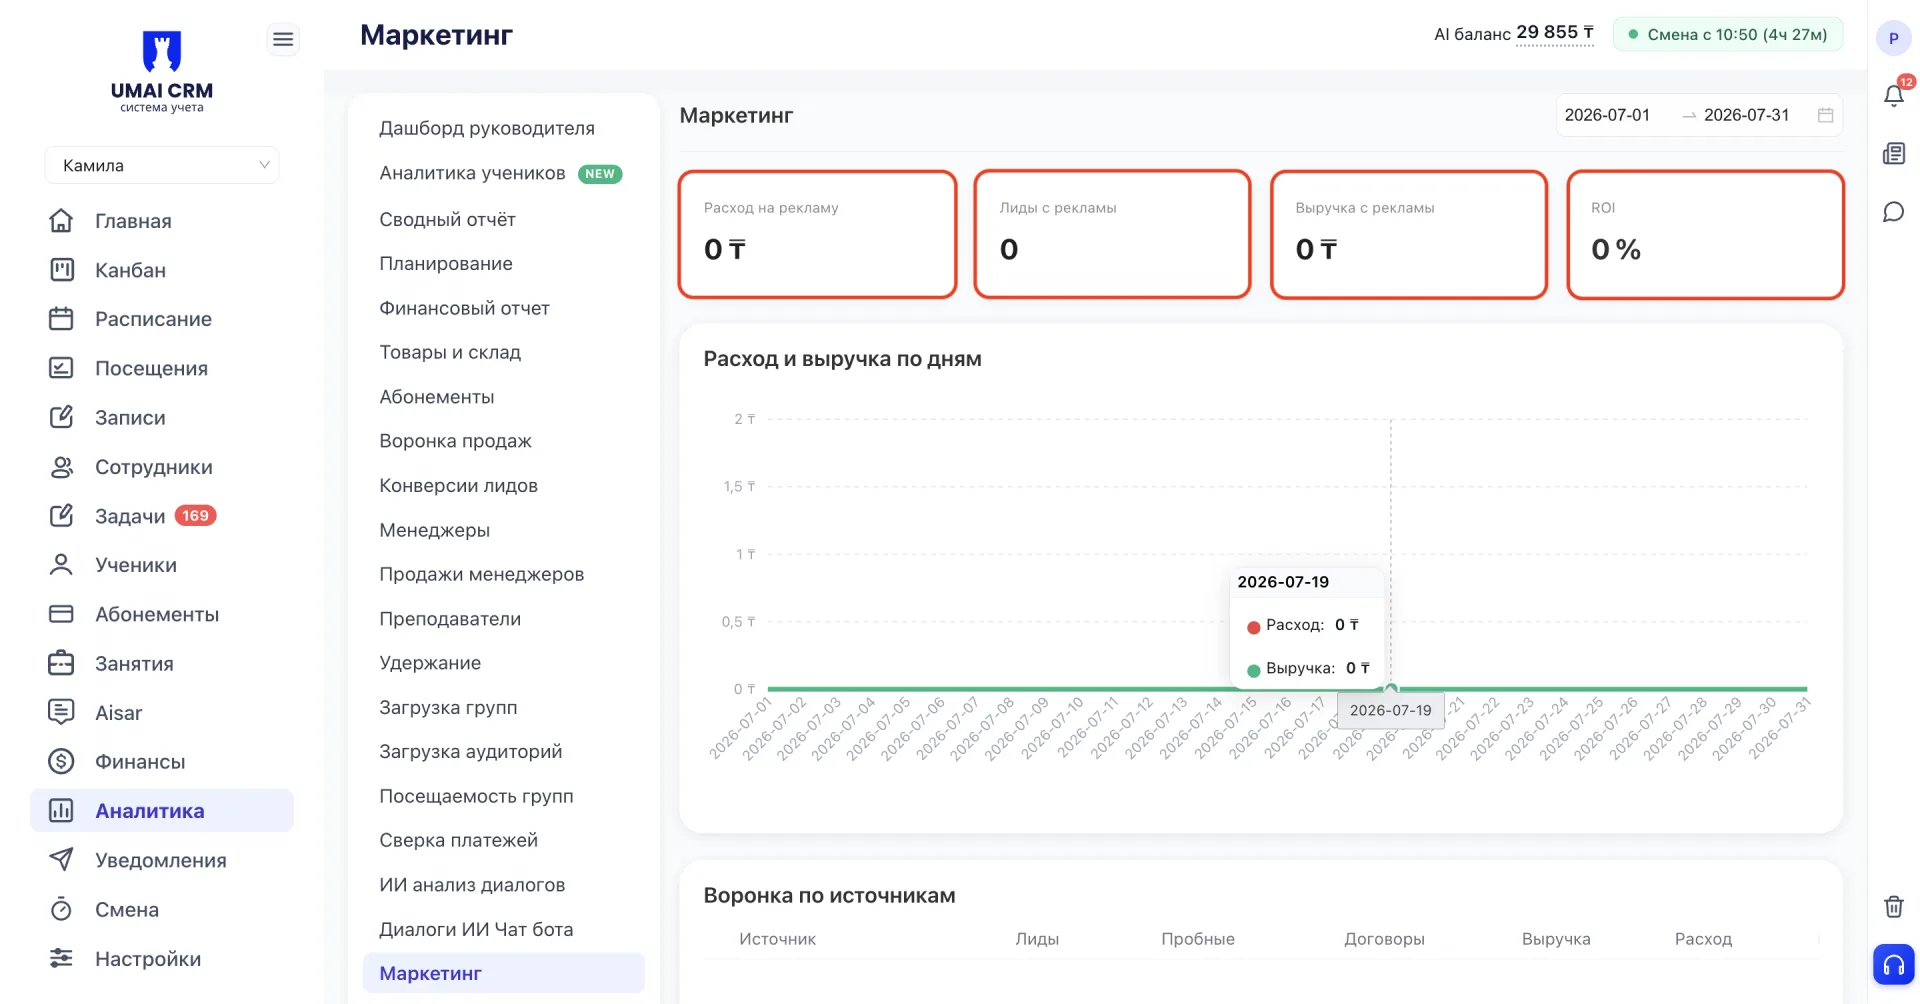
Revenue from ads — the sum of sales that were completed with payment and linked specifically to advertising leads.
ROI (Return on Investment) — reflects whether the advertising paid off. It is calculated as the ratio of the difference between revenue and expense to expense. If the advertising generated no revenue at all, ROI will be -100%, meaning money was spent but there was no return. Negative ROI does not always mean that the advertising does not work: some deals may close after the selected period ends, and then their revenue will fall into the KPI of the next month while the expense is already accounted for in the current one.
4. Chart “Expense and revenue by days”
The chart shows expenses and revenue dynamics for the selected period. You can change the chart scale to analyze data for different time intervals. The red line shows advertising expenses, and the green line shows received revenue. This helps understand on which days the advertising budget was spent more actively and when advertising resulted in payments.
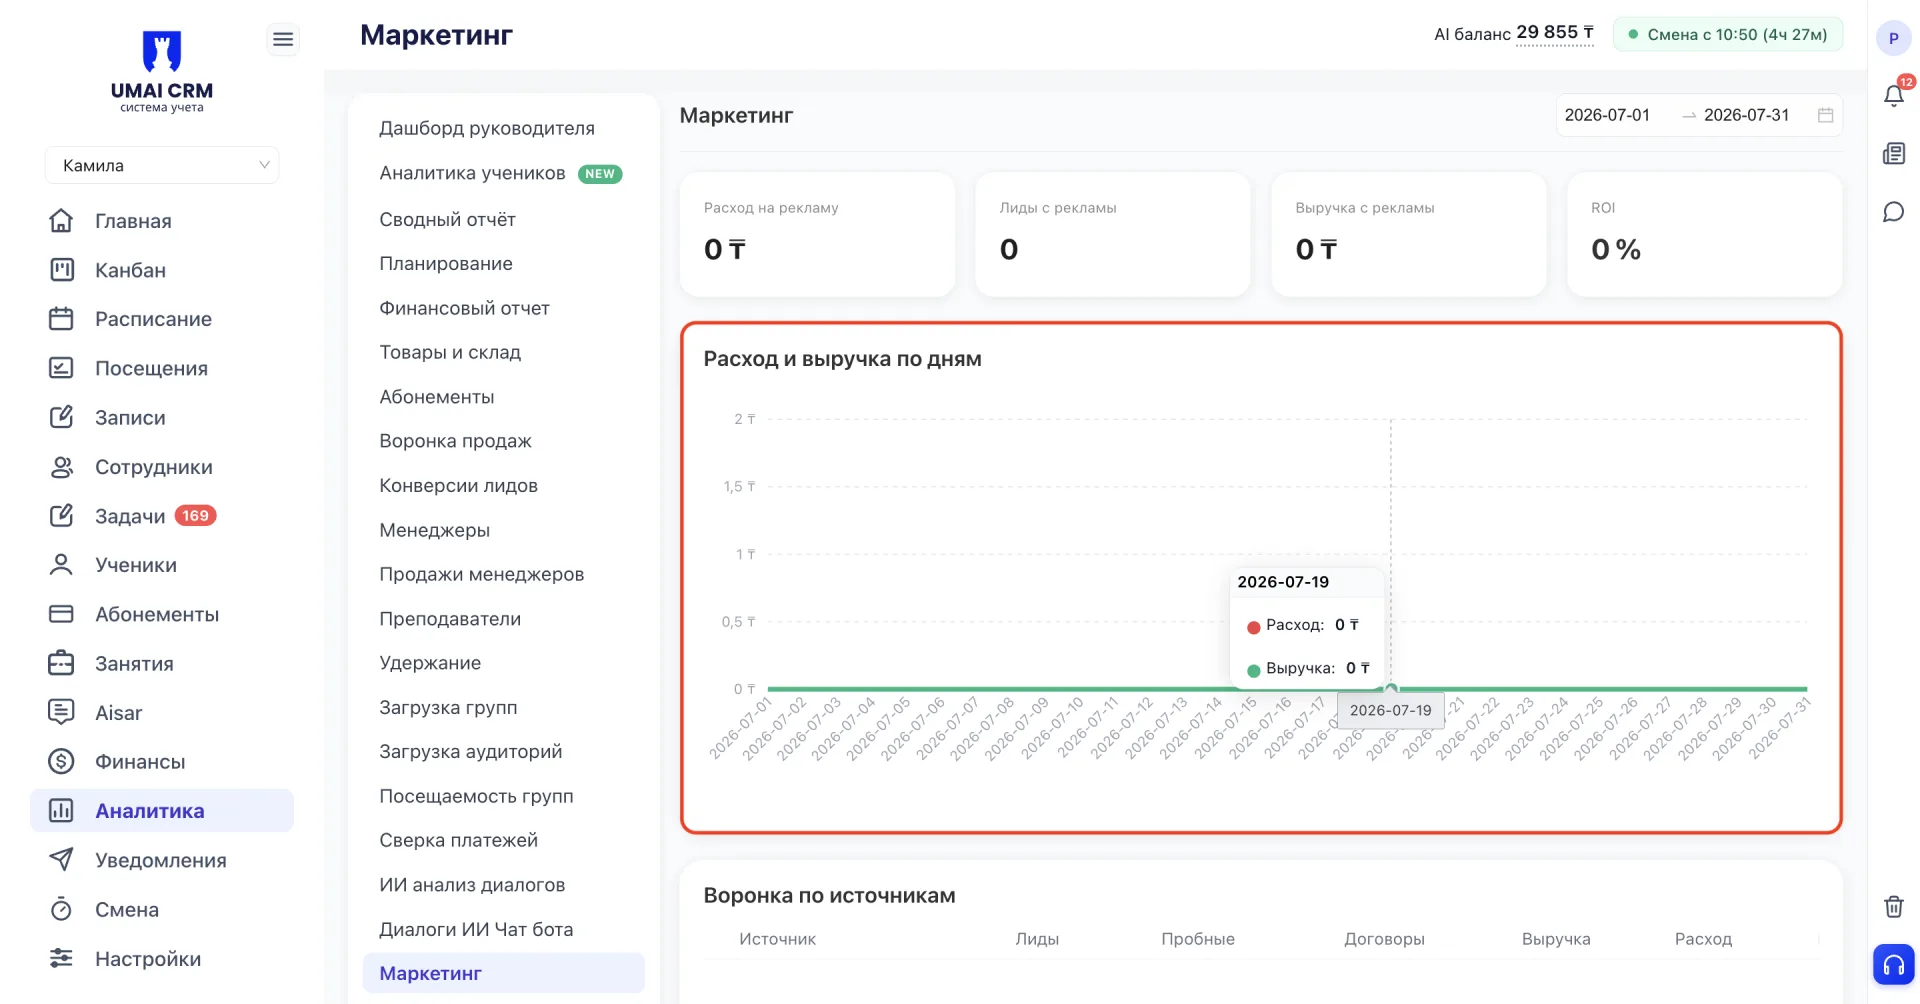
If the green line remains at zero for a long time and appears only on separate days, this is normal. There is usually some time between the first client inquiry and the payment, since the client may first attend a trial Class and then decide to purchase.
5. Sales funnel by sources (Воронка по источникам)
The table shows how the advertising budget passes through the sales funnel for each traffic source. It shows how many Leads there were, how many of them reached a trial Class, how many signed a contract, what the revenue and expense for the source are, and what its ROI is.
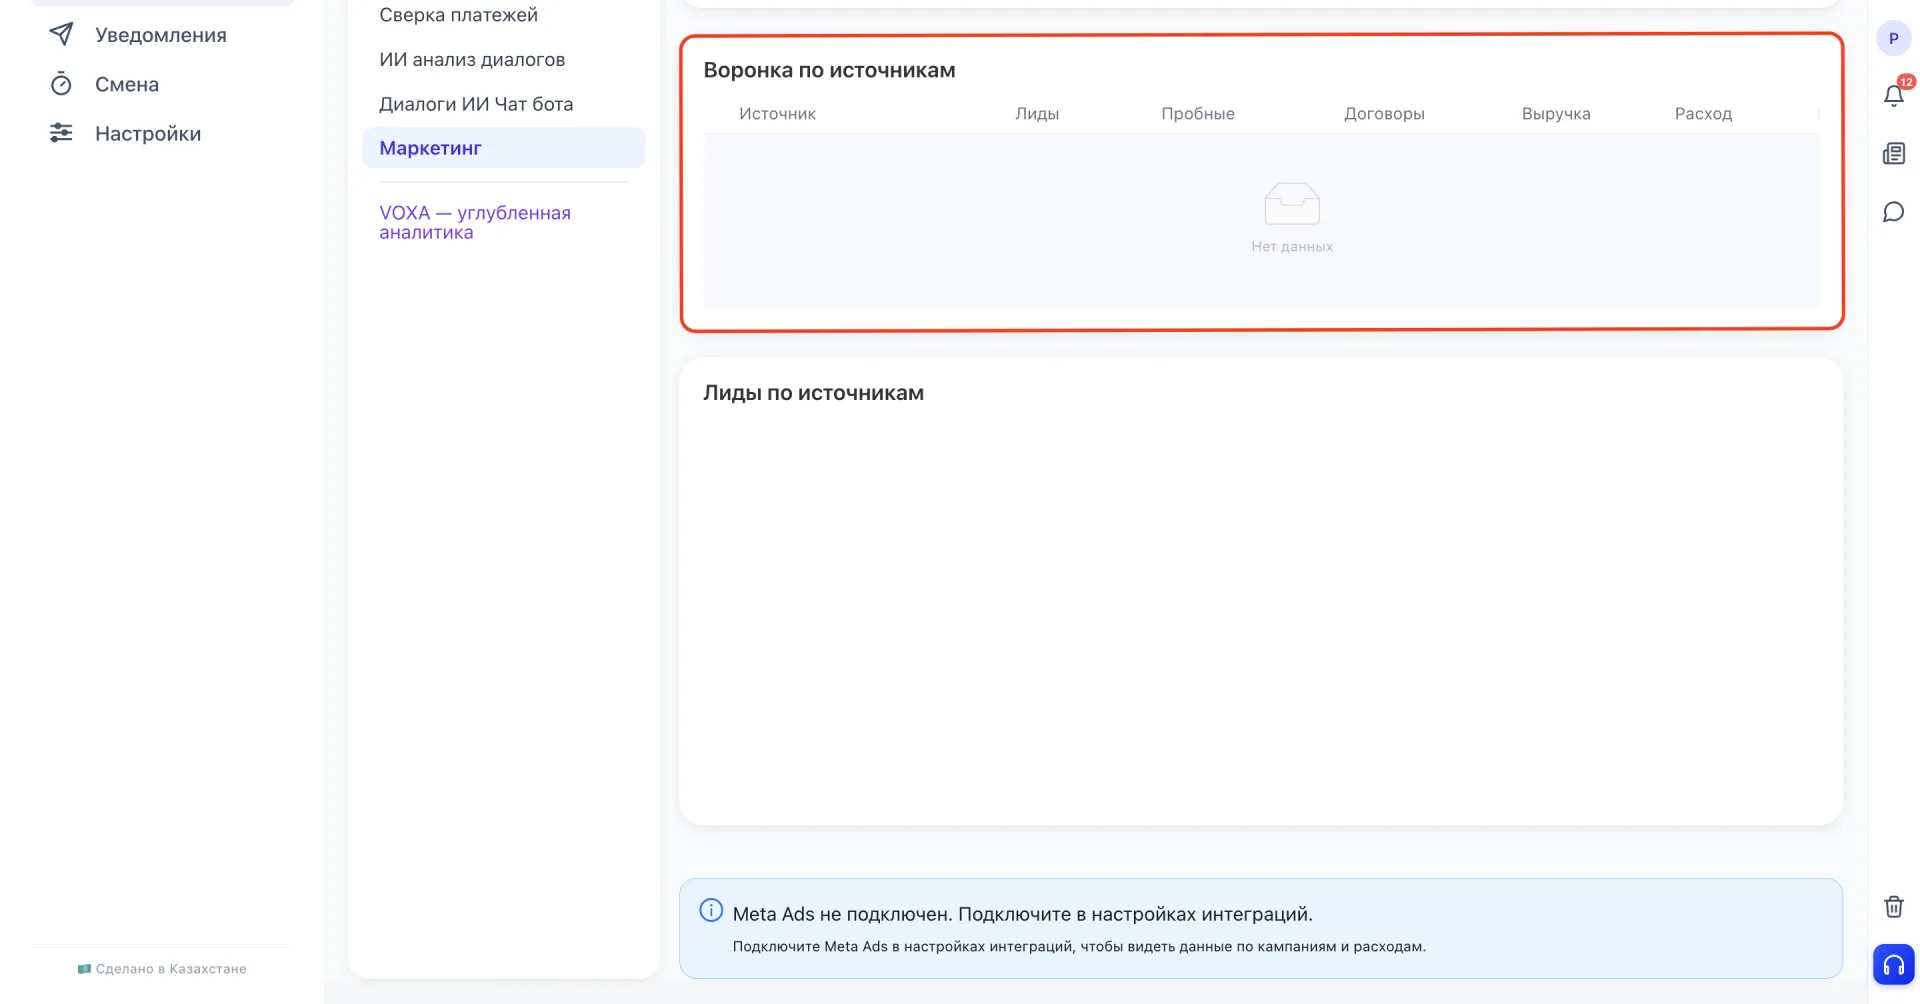
An important nuance. Not all advertising expense is included in this table — only the portion that can be attributed to a specific source through at least one Lead. If an ad did not bring any Leads, its expense cannot be assigned to any source, so such amounts are shown as a separate row under the table, not inside it.
For example, the total advertising expense for the period was 450,000 tenge. The expense shown in the source table is 420,000 tenge. The remaining 30,000 tenge were spent on ads that did not bring any Leads, so this amount will not be included in the table rows. At the same time the money is not lost and does not disappear from the reporting. It is still accounted for in the total expense at the top of the page.
Therefore, the expense by source in this table will always be less than or equal to the total expense above. This is not an error but a consequence of how each of these figures is calculated.
6. Leads by sources
Displayed as a pie chart that shows the share of each source in the total number of Leads. While only one traffic source is connected, the chart will be filled entirely with one color; this is normal and does not indicate a data error.
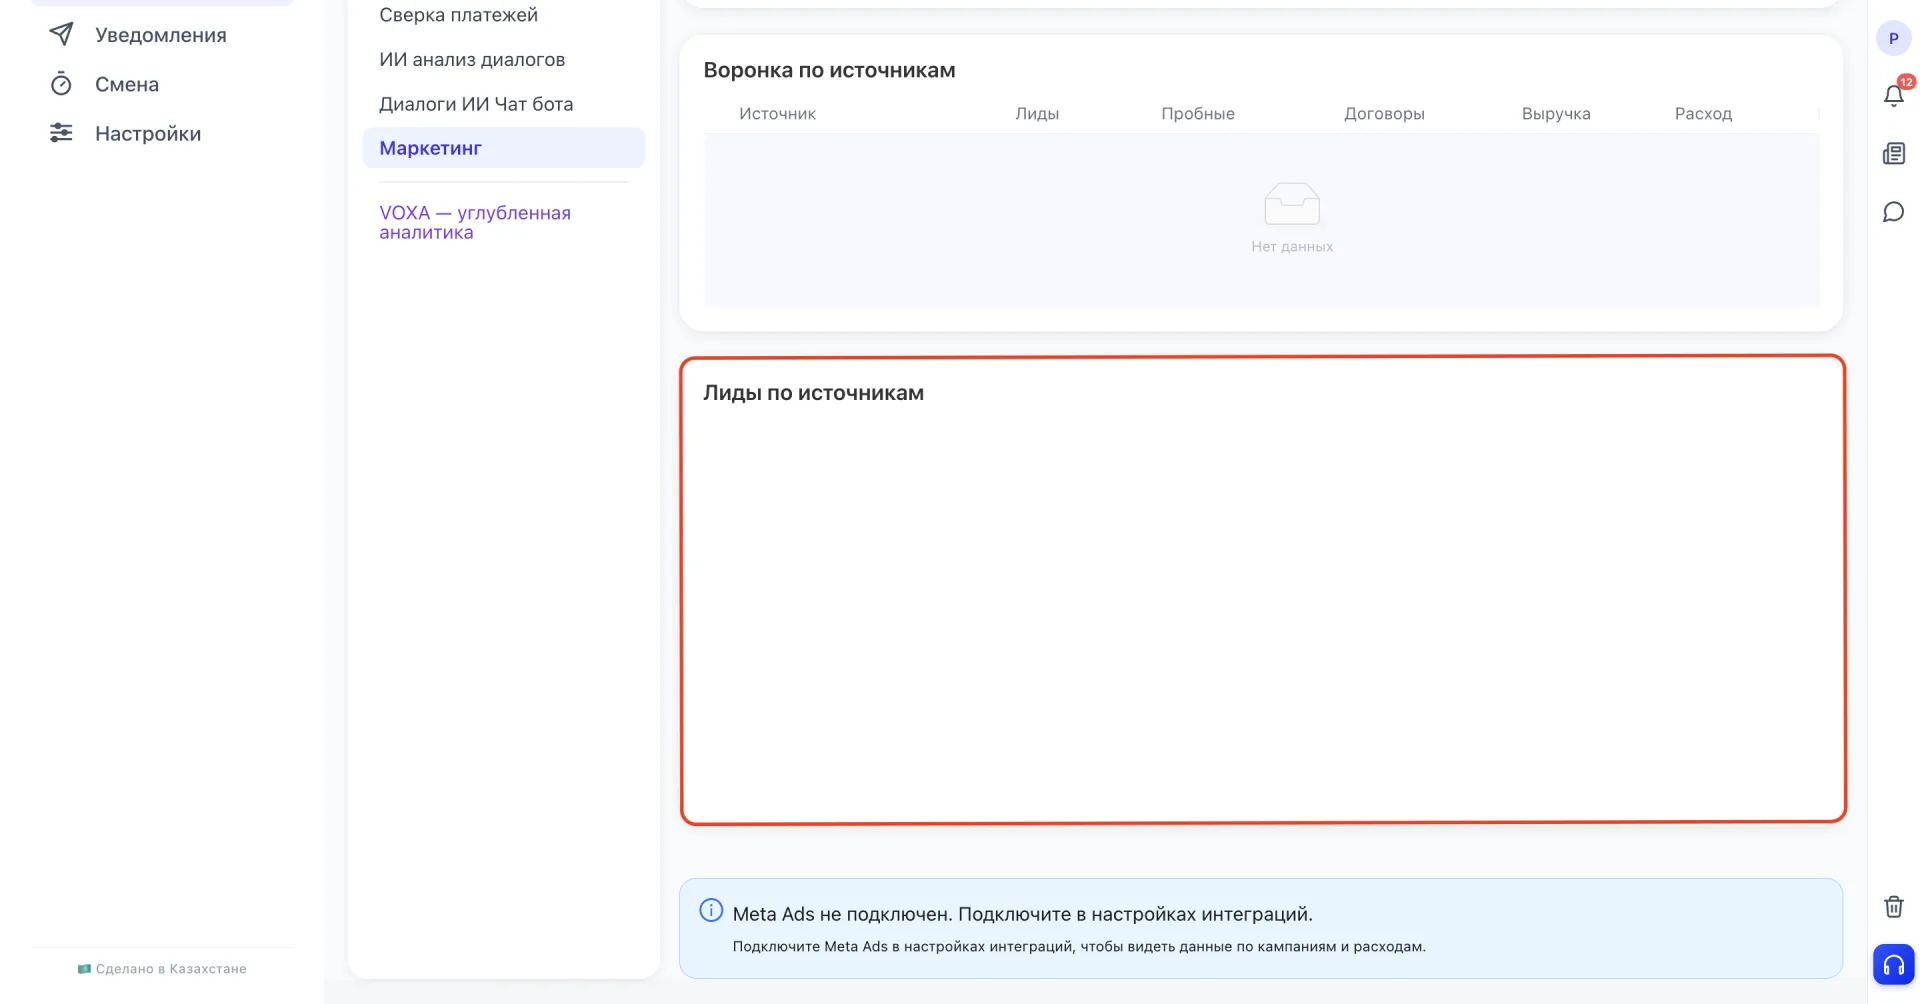
When more than one source is connected, several segments will appear on the chart, and you will be able to compare sources against each other.
7. Report on Meta Ads
The section contains a detailed report on advertising data retrieved directly from the Meta Ads ad account. Unlike the block Sales funnel by sources (Воронка по источникам), where data is grouped by traffic source as a whole, this report allows you to examine advertising effectiveness at the level of individual campaigns, ad groups and ads, which makes it possible to determine which specific advertising elements work and which spend the budget without result.
The report is available at three nesting levels: campaigns, ad groups and individual ads. Each lower level is a breakdown of the higher one: ad groups belong to a campaign, and ads belong to an ad group. The expense at the campaign level equals the sum of the expenses of all ad groups within it.
For example, if a campaign has two ad groups with expenses of 190,000 tenge and 10,000 tenge, the campaign expense will be 200,000 tenge. Data does not duplicate or get lost when switching between levels.
The following data is indicated for each row of the report.
Name (campaign, ad group or ad, depending on the selected report level) is displayed exactly as set in the Meta Ads ad account. For ad groups and individual ads, the belonging to the parent campaign or group is additionally shown.
Expense shows the amount spent on this level (campaign, group or ad) for the selected period.
Impressions display the number of times the ad was shown to users.
Clicks show the number of clicks on the ad. The value is always less than or equal to the number of impressions.
Leads contain the number of inquiries received from this level and processed in the CRM, i.e., converted into Leads.
Contracts record the number of inquiries that resulted in signing a contract.
Revenue indicates the sum of payments associated with this campaign, group or ad.
CPA (Cost Per Action) is calculated as expense divided by the number of Leads and determines the average cost of one Lead at this level. If there are no Leads, the value is not calculated and is shown as a dash.
ROI (Return on Investment) is calculated as the ratio of the difference between revenue and expense to expense. If there is no revenue, the metric equals -100%.
8. How to read the metrics
The table of numbers by itself will say little if you do not compare metrics with each other.
Many Leads, but ROI -100%. This situation is visible for most campaigns in the report when there are Leads but no revenue at all. This is a reason to look not at the advertising itself, but at what happens with the Lead afterwards. Check whether the Lead gets to a trial Class and why it does not close into a contract. If the same picture repeats across all campaigns without exception, the likely reason is not the ads but the sales department or the speed of processing inquiries.
Low CPA does not mean a good campaign. A campaign may have a low cost per Lead, but if none of those Leads reach a trial Class or payment, the cheap Lead is still not profitable. A low CPA should be viewed together with the number of contracts and revenue, not in isolation.
Expense in campaigns is higher than in the sales funnel by sources (Воронка по источникам). If you compare the total expense in the campaign report with the expense by source in the funnel, they may not match. The difference is the budget spent on ads that did not bring any Leads, and it is not attributed to a specific source.
The sum of Leads by campaigns is less than in the card "Leads from ads (Лиды с рекламы)" (the metric at the top of the page). This happens if a manager received an inquiry from advertising via the Kanban but did not convert it into a Lead inside the CRM. Such an inquiry does not fall into the campaign breakdown, although it was actually received from advertising. For the Marketing section data to be accurate, each inquiry from the Kanban must be converted to a Lead in time. This not only corrects the statistics but also preserves the inquiry history in the system.
Important to consider:
- The currency rate used to convert Meta Ads to tenge is displayed directly under the expense amount. If the rate changed during the period, the final amount in tenge may not equal a direct multiplication of the dollar amount by the current rate.
- Expense for ads without a single Lead is not included in the "Sales funnel by sources (Воронка по источникам)" table, but is included in the total expense in the top card and in the daily chart.
- If an inquiry from advertising is not converted from the Kanban into a Lead, it is not included in the report by campaigns, ad groups and ads, although the advertising expense that generated this inquiry is still charged. Because of this, the sum of Leads in the campaign breakdown may be less than in the card "Leads from ads (Лиды с рекламы)" and in the Sales funnel by sources (Воронка по источникам). To avoid discrepancies, inquiries must be converted into Leads in time.
- CPA is calculated only based on accounted Leads, not contracts or revenue, so a campaign with a low CPA is not necessarily effective from a sales perspective.
- ROI shows -100% in two different cases. This happens when there was no revenue for the campaign at all, and when a deal is not yet closed and the revenue will appear later in another period. These are two different situations that look identical in the report.
- Metrics in all blocks, except the Meta Ads advertising report, depend on the period selected at the top of the page. When dates are changed, data is recalculated simultaneously.