The financial report shows how the center actually operates in numbers: how much money came in, where it was allocated, and what financial result was achieved for a given period.
1. Фильтры и период выбора
В верхней части раздела находятся фильтры и настройка временного диапазона. Они позволяют анализировать финансы не за все время, а за конкретный интересующий отрезок.
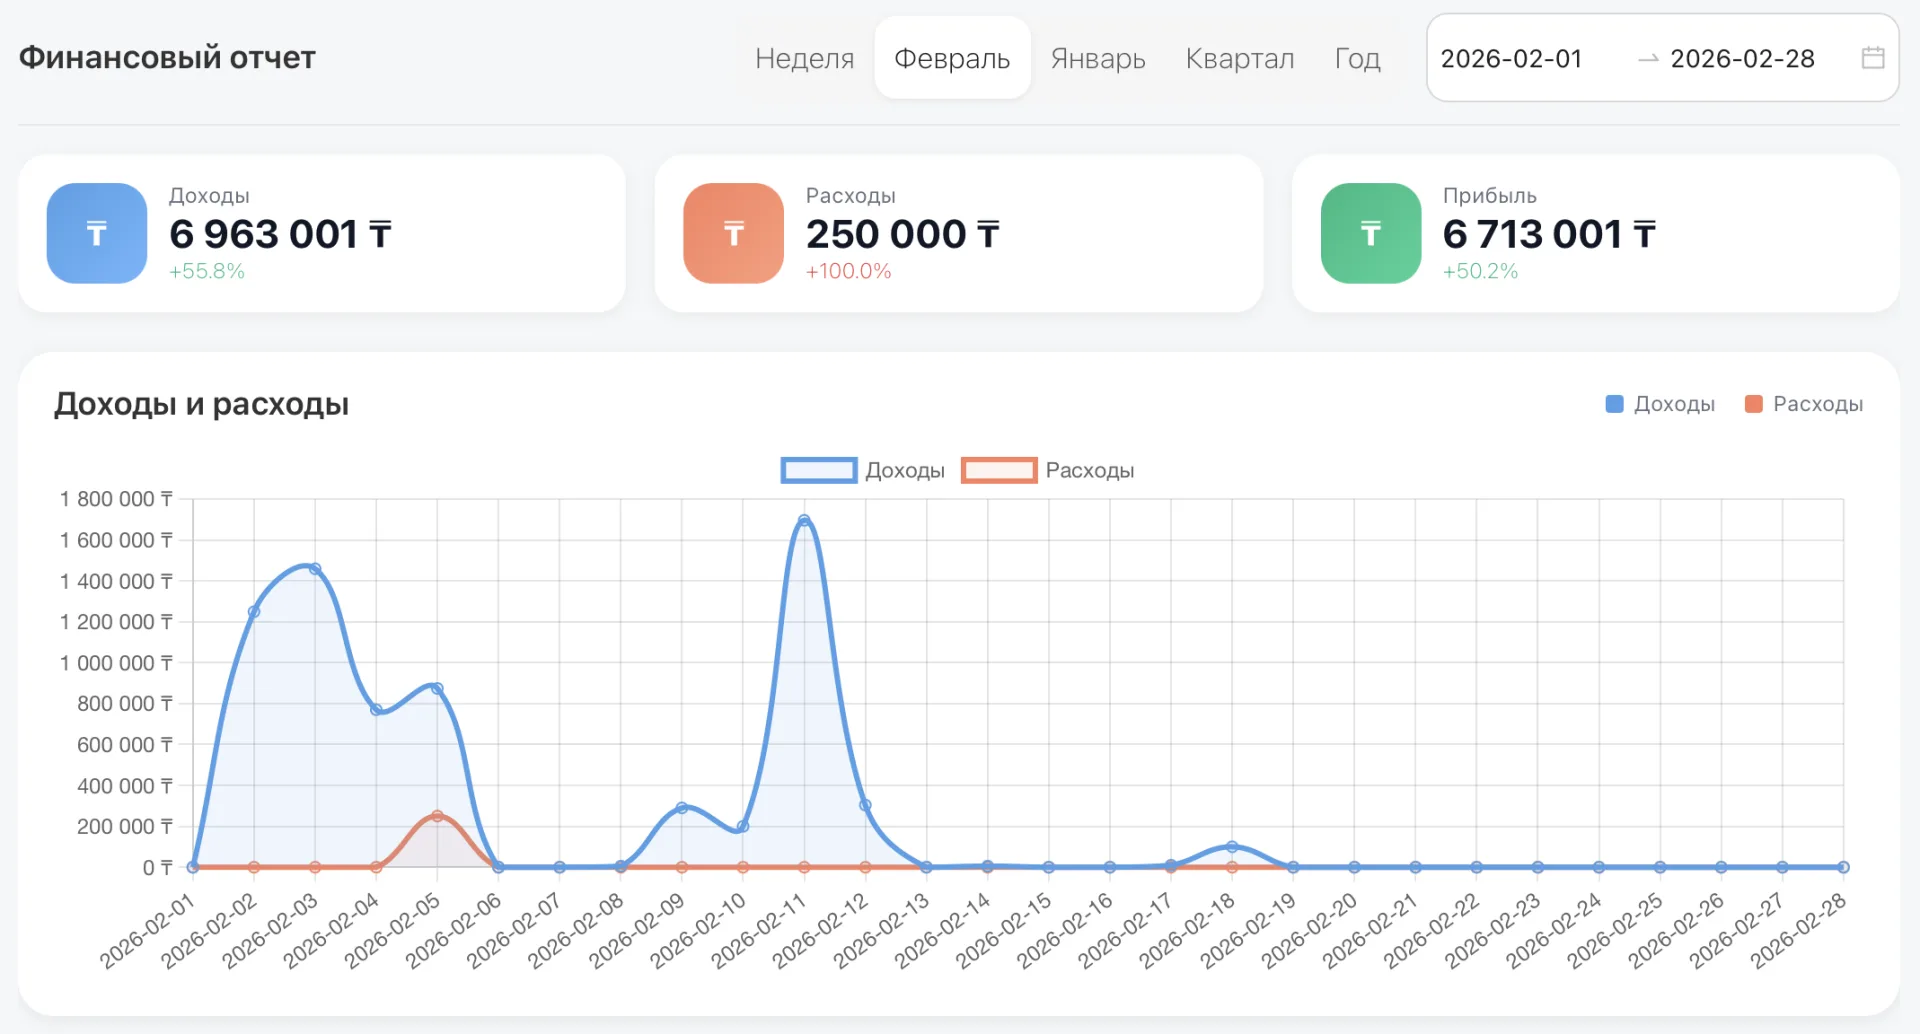
Когда открываются финансовые данные без фильтрации, легко запутаться: цифр много, движения разные, понять реальную картину сложно. Настройка дат позволяет сфокусироваться на нужном отрезке времени и увидеть фактический результат.
Доступны варианты: неделя, месяц, квартал, год и произвольные даты. Это дает возможность оценить показатели именно за тот период, который вы хотите разобрать.
После выбора периода отчёт автоматически пересчитывается: обновляются доходы, расходы, прибыль и графики. Не нужно выгружать данные или считать вручную — система сразу показывает актуальные цифры.
2. Income, Expenses and Profit
В самом верху финансового отчёта расположены три главных показателя, которые дают быстрый обзор финансового состояния вашего бизнеса:
- Income — how much money was received for the selected period. These are all client payments, for example for Memberships or services.
- Expenses — how much money was spent during the same period. This includes salaries, rent, purchases and other costs.
- Profit — the difference between income and expenses. This metric shows how much money remains after all expenses and how efficiently the business operates.
These cards help you quickly understand the health of your finances without digging into report details, and also highlight the trend compared to the previous period.
3. Chart “Income and Expenses”
На этом графике показано, как менялись ваши доходы и расходы по месяцам за выбранный период.
- Income is shown by a blue line, and expenses by a red line.
- On the horizontal axis (below) the months are displayed — this time scale helps understand when changes occurred.
- On the vertical axis (left) the amounts are indicated in tenge, which allows you to immediately assess the scale of the financial flows.
You can control data display — by clicking the colored icon for income or expenses you can hide the unwanted line on the chart to focus on a single metric. Clicking again will restore it.
This tool helps to see how income grows and how expenses are controlled, as well as quickly identify sharp changes or anomalies. The chart makes it easier to understand how effectively the business is developing financially and where attention is needed.
4. Monthly dynamics (table)
The table shows income, expenses and profit for each month of the selected period. At first glance it’s just rows of numbers, but it helps reveal the real picture of cash movement in the business.
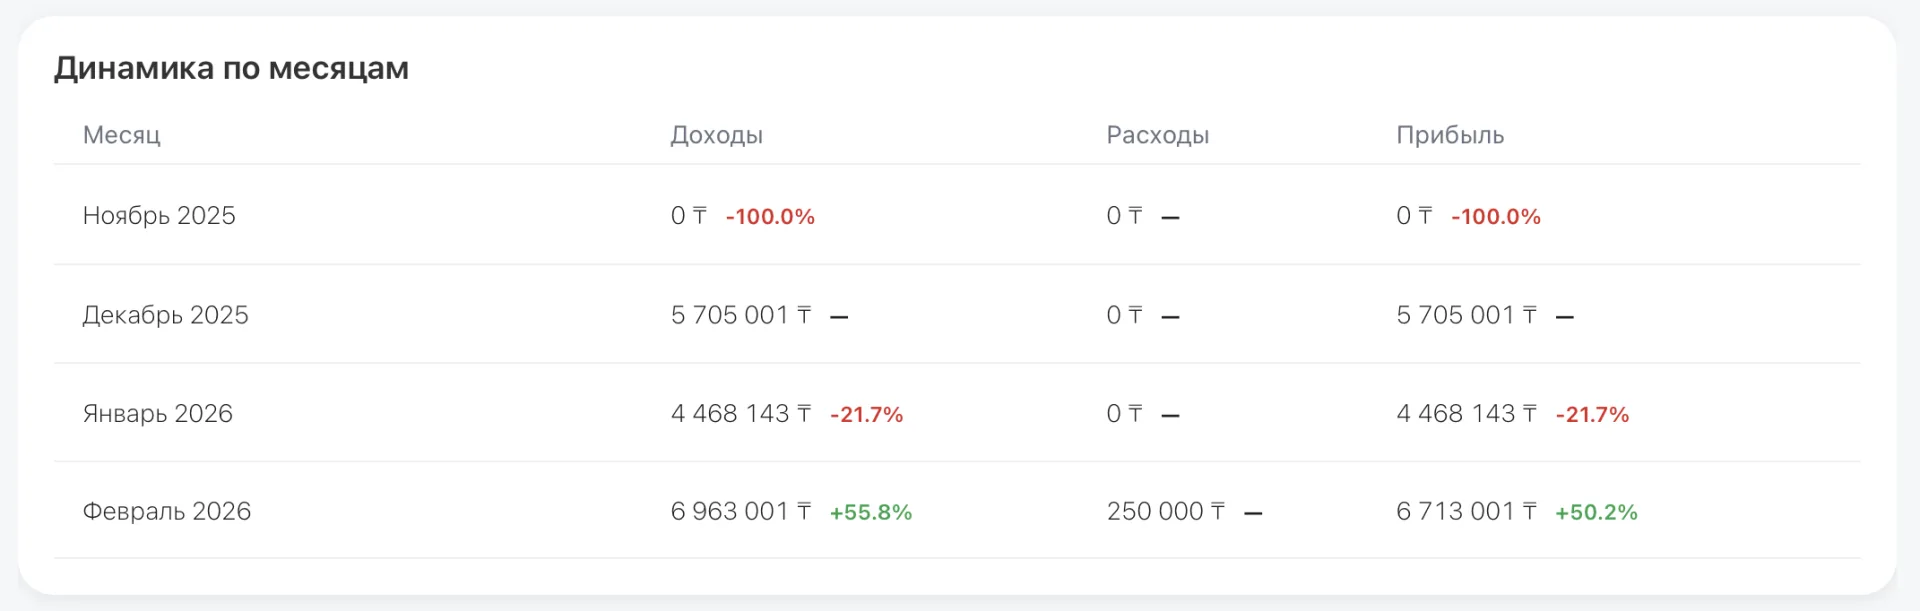
The table is needed to see how income and expenses change month to month, track growth or decline of metrics and understand the consequences of your actions — for example, schedule changes, promotions or adjustments to trial Classes. It shows details not visible in the summary cards above and helps forecast future expenses, income and profit.
Working with the table is simple: compare neighboring months’ metrics, pay attention to sharp swings and figure out what caused them. Use this information to adjust processes, improve results and make more informed planning decisions.
5. Report for the selected period
The report for the selected period shows in detail what composes income and expenses, and what net profit the business receives. There are many numbers, but each part provides useful information for analysis.
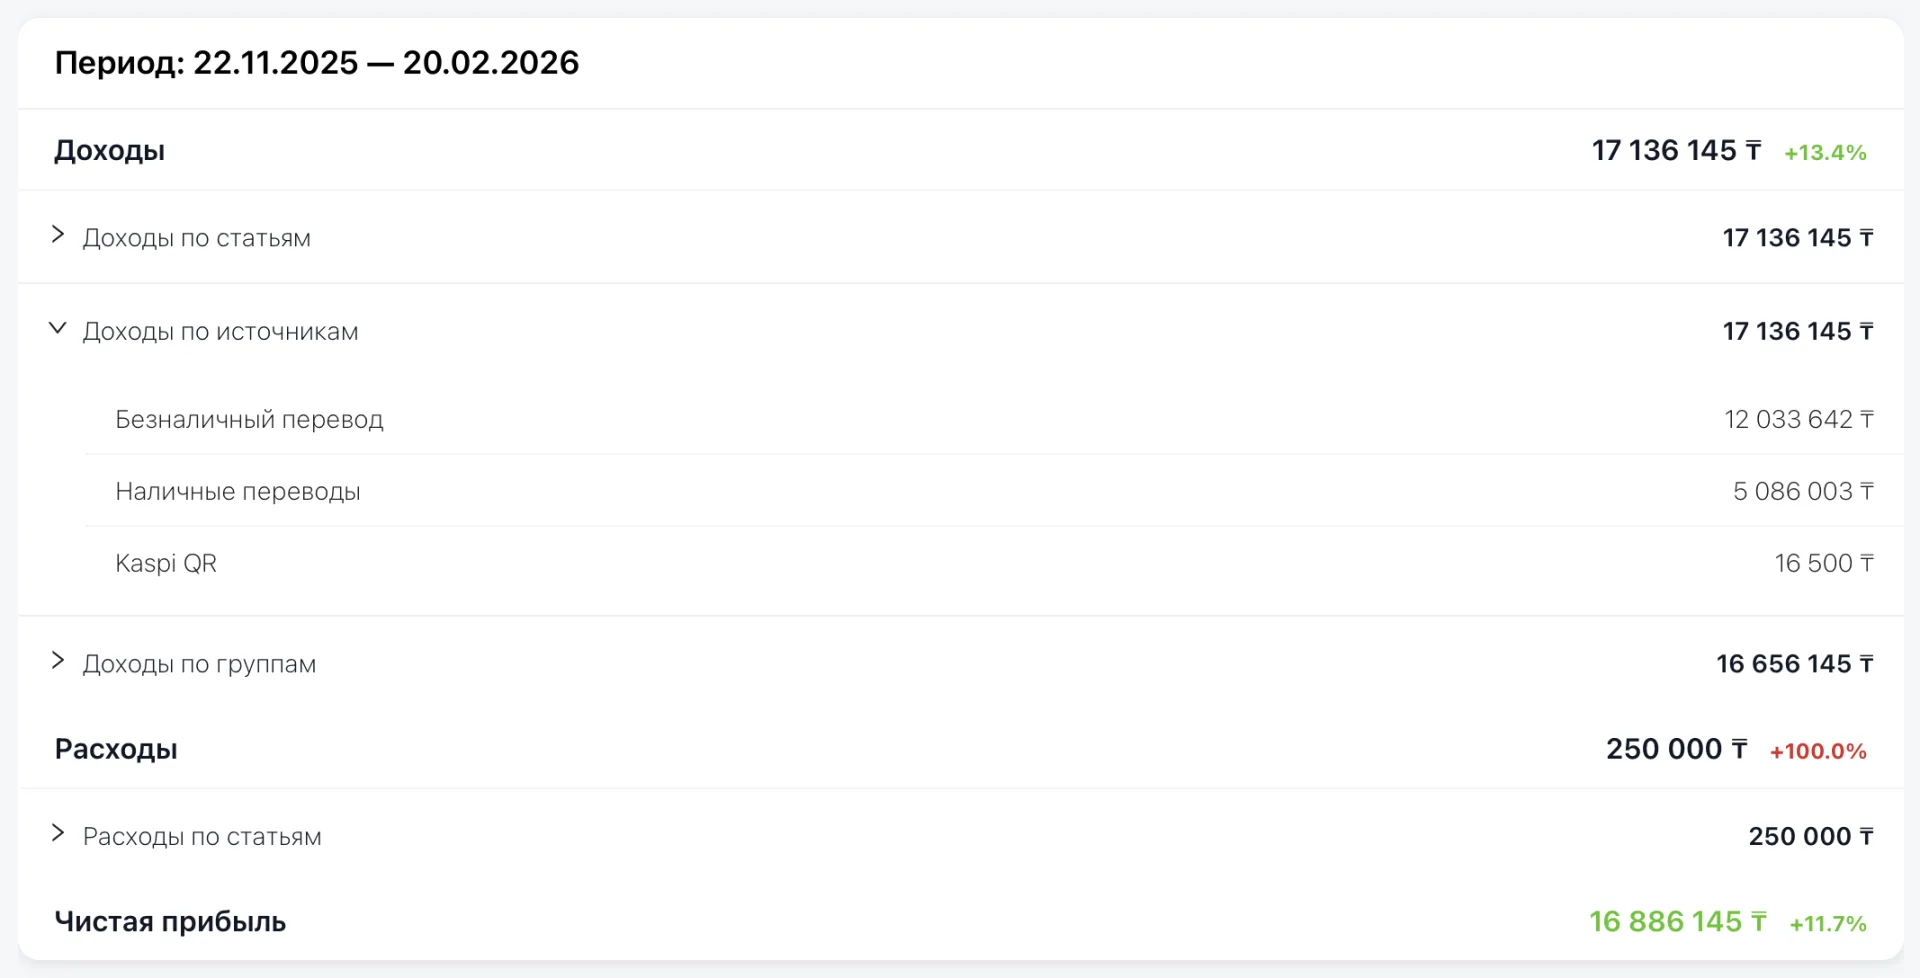
Income — the section is divided into three directions:
- Income by items — shows which types of services or goods generate income. For example, Memberships, trial Classes, additional services.
- Income by sources — reflects how the money was received: card payments via terminal, Kaspi QR, bank transfer, etc. This helps understand which payment channels are most convenient for clients.
- Income by groups — shows income from specific groups and directions: trial Classes, weekend clay modeling, English and others. Such a breakdown helps see which groups bring the most money and where there is growth potential.
Expenses
- Expenses by items — details what the money is spent on. For example, rent, salaries, materials purchases and so on. This allows controlling costs and seeing where expenses can be optimized.
Net profit
- The final profit for the selected period is displayed in a separate column. All operations affecting profit are also listed on the side as figures, which allows understanding how the final result is formed.
The report shows where the money comes from and what it is spent on, helps evaluate the efficiency of groups, directions and payment methods. Thanks to this you see the real picture of profit and costs and can make balanced managerial decisions.
6. Reconciliation with Memberships for the period
This block shows how sales of Memberships match actual payments, helps track financial discipline and avoid payment delays.
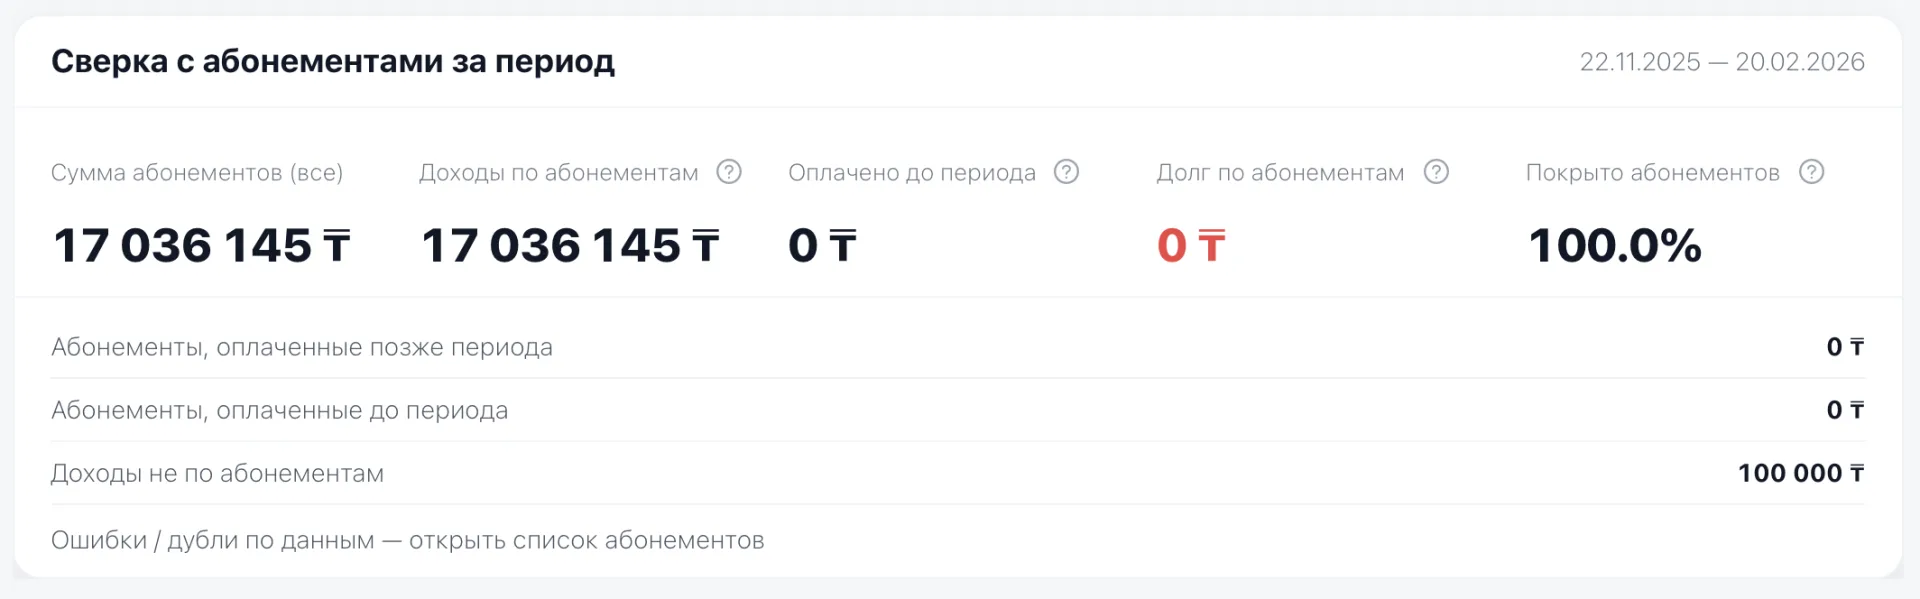
Key figures that give a quick picture for Memberships are collected at the top of the block.
Total Memberships amount
The total amount of Memberships sold for the selected period — these are accruals, what the center billed clients. This metric helps understand the volume of client obligations to the center. It is not actual money, but the amount of concluded sales.
By comparing this metric with actual income you can monitor payment dynamics. If the total is large but payments are few — debt is growing.
Income from Memberships
Displays the money actually received for these Memberships during the selected period. These are real receipts to the cash register or account — what clients truly paid.
The metric helps understand how much of what was sold is already paid. The difference between this amount and the total Memberships amount shows the level of debt.
Debt on Memberships
The amount of unpaid or partially paid Memberships for the selected period. This is money the center is supposed to receive but has not yet received.
It reflects the volume of money the center is due. An increase in this metric means declining payment discipline and a risk of insufficient working capital.
Paid before the period
Payments made earlier but related to the selected period. This metric helps correctly allocate income over time and see the full picture of settlements with clients.
If the value is nonzero, it is important to consider that part of the obligations were closed earlier.
Coverage of Memberships
The percentage of Memberships that have been paid fully or partially.
This is a quick indicator of payment discipline. A low percentage means that a large portion of sales is not backed by actual money. Growth of the metric indicates stabilization of the financial flow.
Memberships paid after the period
The amount of payments that were made after the selected period but relate to it.
The metric helps understand whether there were delays in payments and how quickly clients close their debts.
If there are many such payments, it is worth analyzing whether this is a systemic delay or isolated cases.
Memberships. Paid before the period
The amount of payments made in advance — before the start of the selected period.
Allows accounting for prepayments and not distorting the financial picture. Especially important when working with a model of full or partial prepayment.
Income not from Memberships
Income received not from Membership sales: one-off Classes, additional services, materials and others.
The metric helps understand the revenue structure. If the share of such income grows, it means the business partially relies on one-off sales rather than only the subscription model.
This is important for stability analysis: Memberships provide predictability, one-off services are additional income but a less stable flow.
Errors / duplicates in data — open Memberships list
The link opens the «Memberships» page, where possible technical errors or data duplications are displayed. After navigation, the standard Memberships table opens.
If the system detects suspicious data, a red comment appears next to the corresponding field. For example:
- next to status — a note about an incorrect number of Visits (if a Membership is active but the Student has not attended Classes for a long time);
- next to service — a warning about a possible accounting error.
Red comments are indicators requiring verification. They do not block work, but signal a potential inaccuracy that should be corrected so financial metrics remain correct.
Even a small inaccuracy in data can distort income amounts, debts and coverage percentages. Checking this section helps maintain the correctness of financial analytics.
Clients without payments
The list of clients who have unpaid Memberships.
Used for prompt work with debts and control of payment discipline. You can use this list to arrange reminders or contact clients.
Memberships without payments
The list of specific Memberships that have no payments.
Allows seeing the problem not by total amount but in detail: which groups, which directions and which periods create the debt.
The financial report consolidates data on Memberships, trial Classes and Leads conversions. It shows actual results, helps identify deviations and helps understand which processes require attention or adjustment.