The summary report collects all key metrics in one place — sales, attendance, revenue, and student activity. You no longer need to switch between different sections: the manager sees the full picture at once and can make decisions quickly.
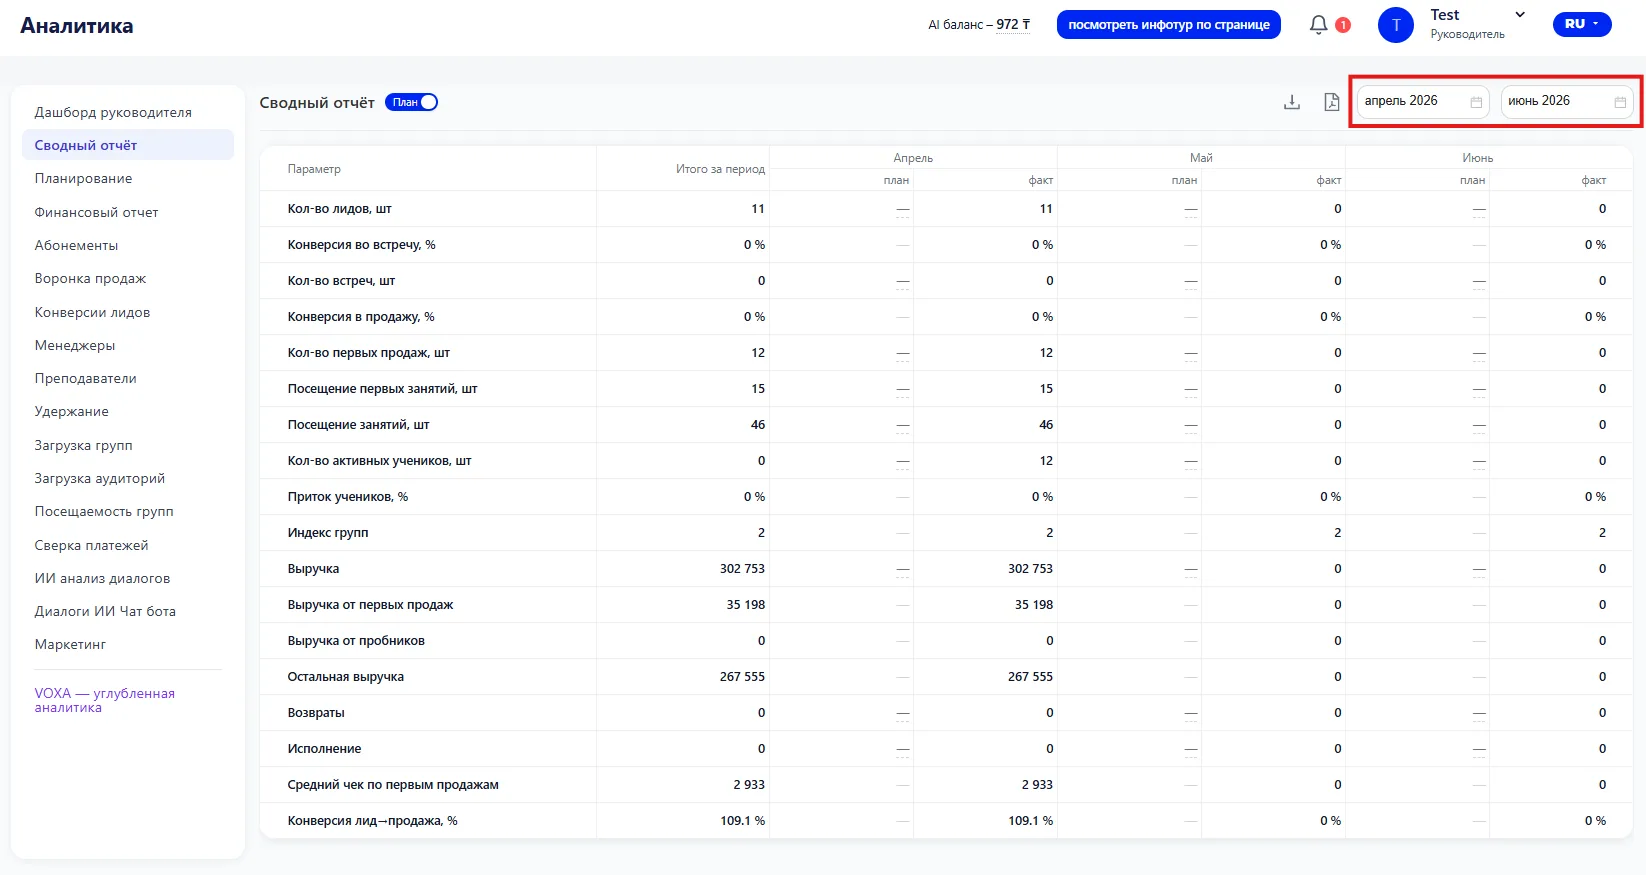
1. Period selection
The top right corner specifies the start and end month. After changing the period, the table updates automatically and shows data for each month within the selected range.
2. "Plan" mode
Without comparing to the plan it is difficult to understand whether the business is growing or just operating as usual. Next to the section title there is a toggle Plan (План). When the mode is enabled, planned indicators appear next to actual values — it is immediately clear where the plan is being met and where there is a lag.
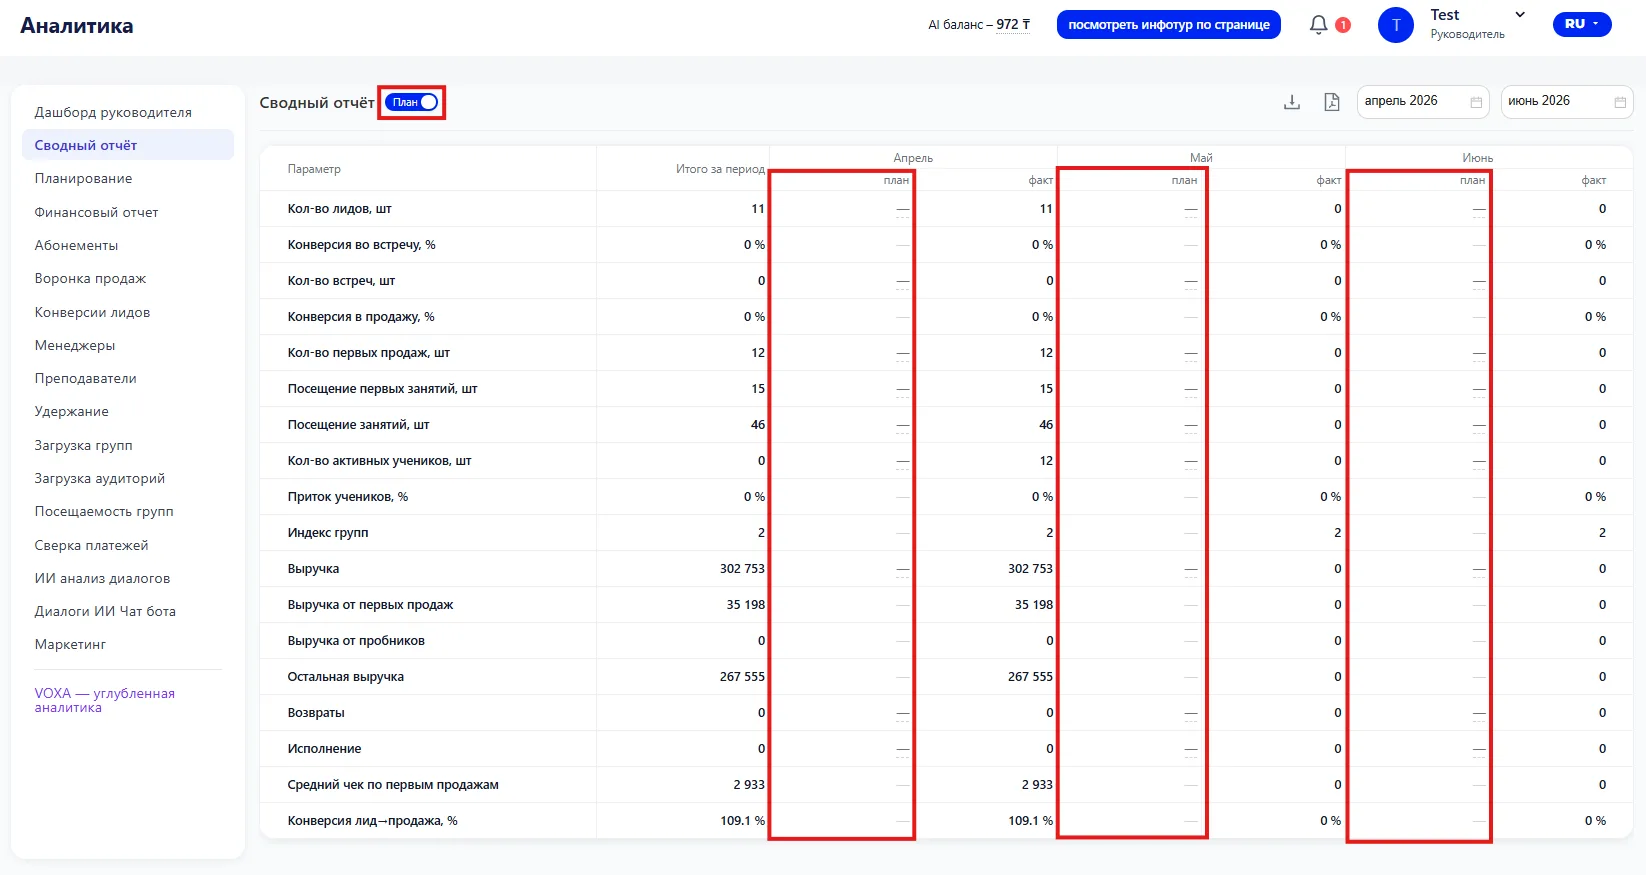
Planned values are set in the Planning (Планирование) section. If the plan is not filled out, dashes will appear in the "plan" columns.
3. Table structure
- Parameter — the name of the metric;
- Total for the period — the cumulative value for the entire selected range;
- Months — for each month two values are shown: plan and actual.
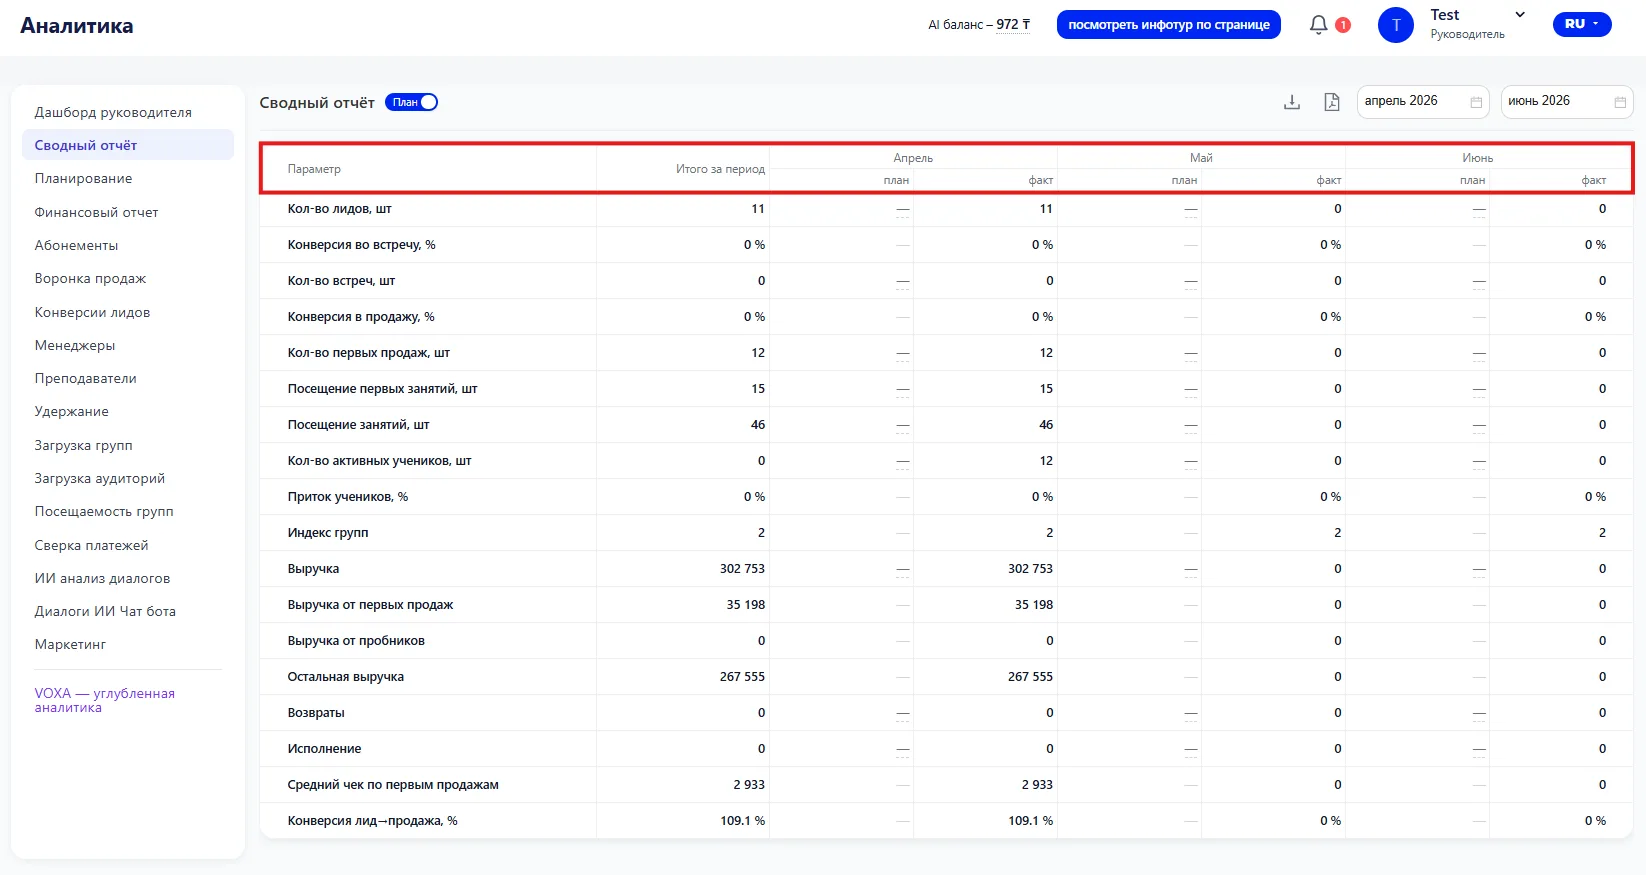
If a planned metric is not specified, a dash is displayed in the cell. If there is no data for the period — the value is 0.
4. Table metrics
Each metric answers a specific question about the school's performance — from the first contact with a client to cash revenue.
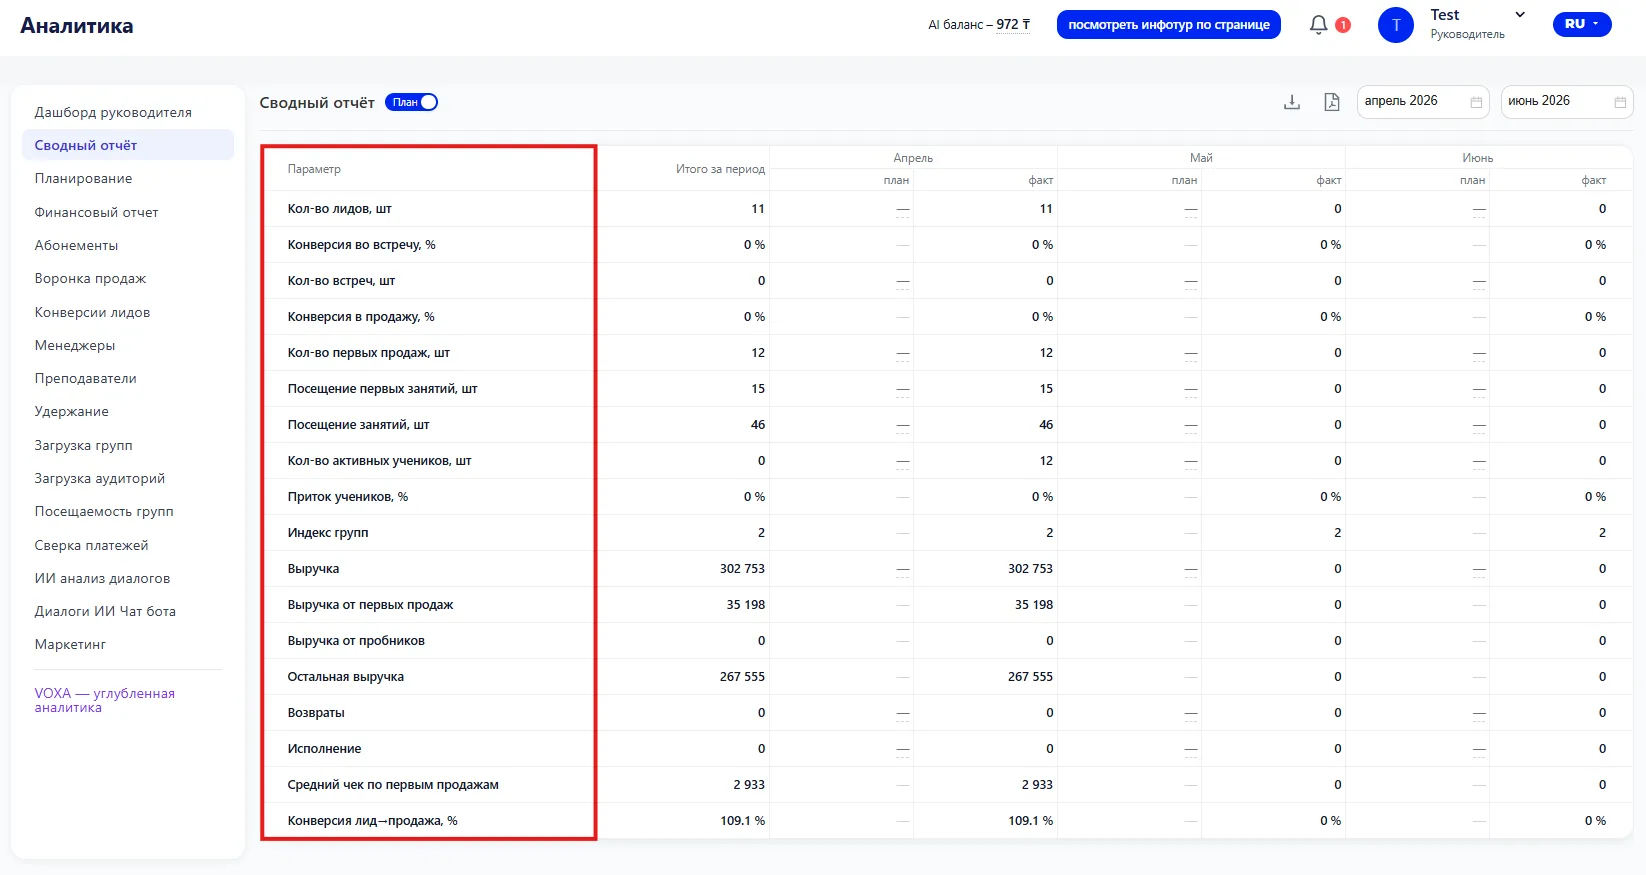
Leads and sales:
- Number of leads, pcs — number of new inquiries for the period;
- Conversion to meeting, % — the share of leads that resulted in a meeting or initial contact;
- Number of meetings, pcs — the total number of meetings held;
- Conversion to sale, % — the share of leads that resulted in a sale;
- Number of first sales, pcs — the number of new customers who made a first purchase;
- Lead-to-sale conversion, % — the overall conversion from first contact to completed sale. If this metric is low — there are losses at some stage of the sales funnel (воронки).
Students and attendance:
- First class attendance, pcs — how many new Students attended the first Class;
- Class attendance, pcs — the total number of Visits for the period;
- Number of active Students, pcs — Students who are currently attending;
- Student inflow, % — the growth dynamics of the number of active Students. A negative value indicates churn;
- Group index — the average number of Students per Group. A low index signals underfilled Groups.
Revenue:
- Revenue — the total sum of receipts for the period;
- Revenue from first sales — income from new customers;
- Revenue from trial lessons — income from trial Classes;
- Other revenue — receipts not included in the previous categories;
- Refunds — the sum of returned funds. An increase in refunds may indicate problems with service quality;
- Fulfillment — the sum of obligations to clients that have not yet been rendered (paid but not delivered);
- Average check for first sales — the average amount of a new customer's first purchase.
5. Data export
The report is available for download in a convenient format. The file can be sent to the team or partners. Export buttons are located in the top right corner:
- CSV — for working in Excel or other editors;
- PDF — for reporting or submitting to management.
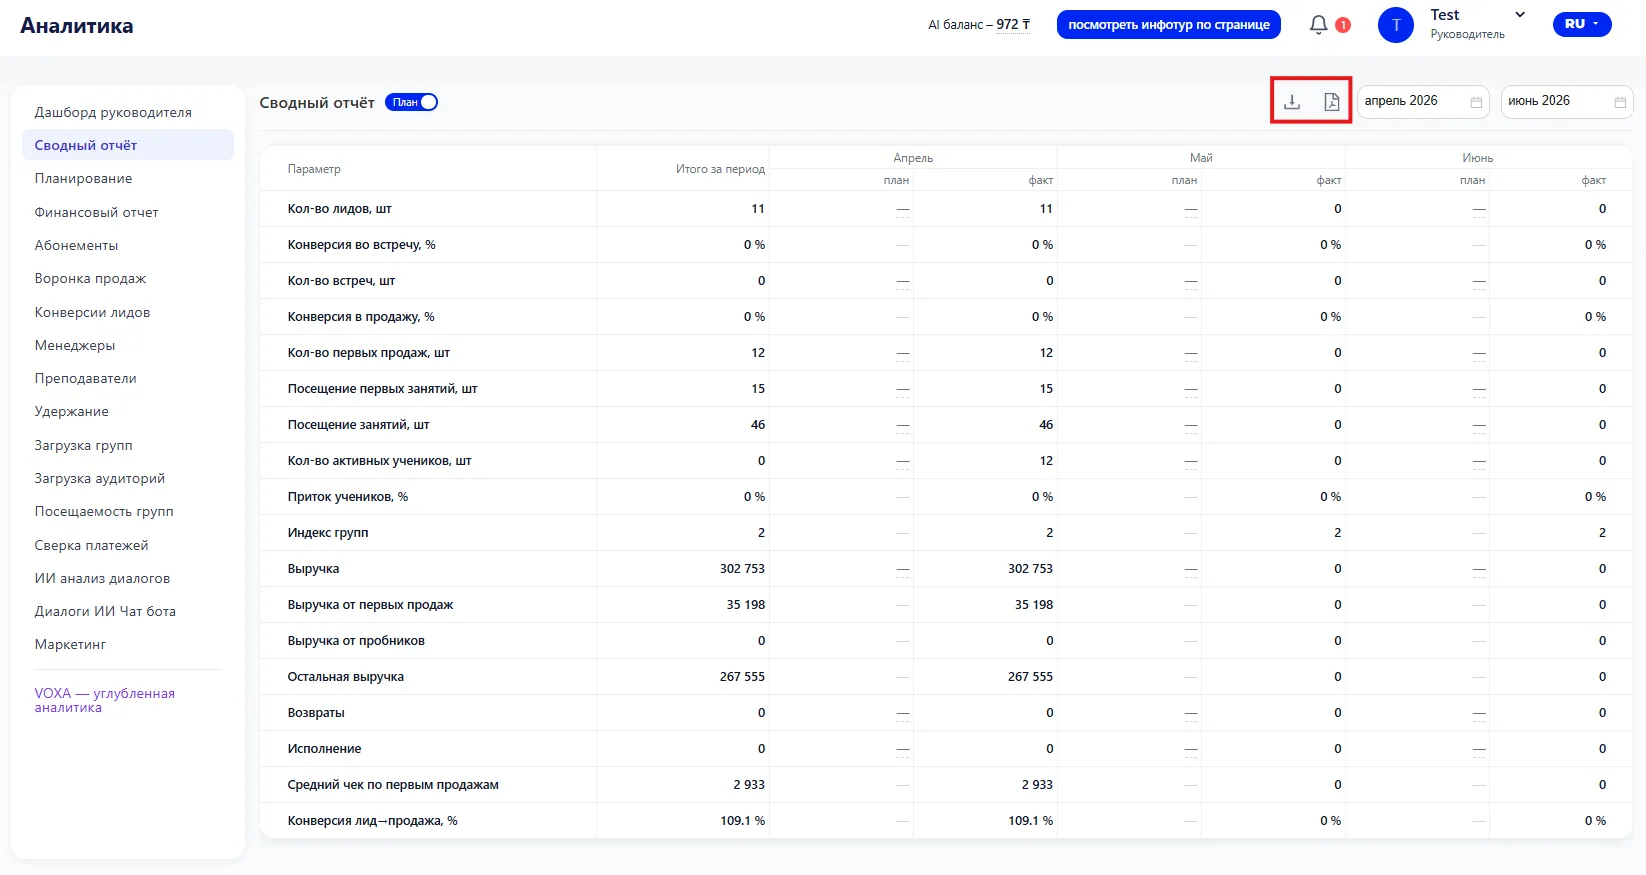
Data for the selected period is exported taking into account current display settings.