The section displays statistics on the center's students for the selected period: branch comparison, key metrics, and a table with data for each student.
Main blocks:
- Accessing the section
- Selecting the period
- Summary by branches
- Filters and export
- Key metrics
- Students table
- How to read the metrics
1. Accessing the section
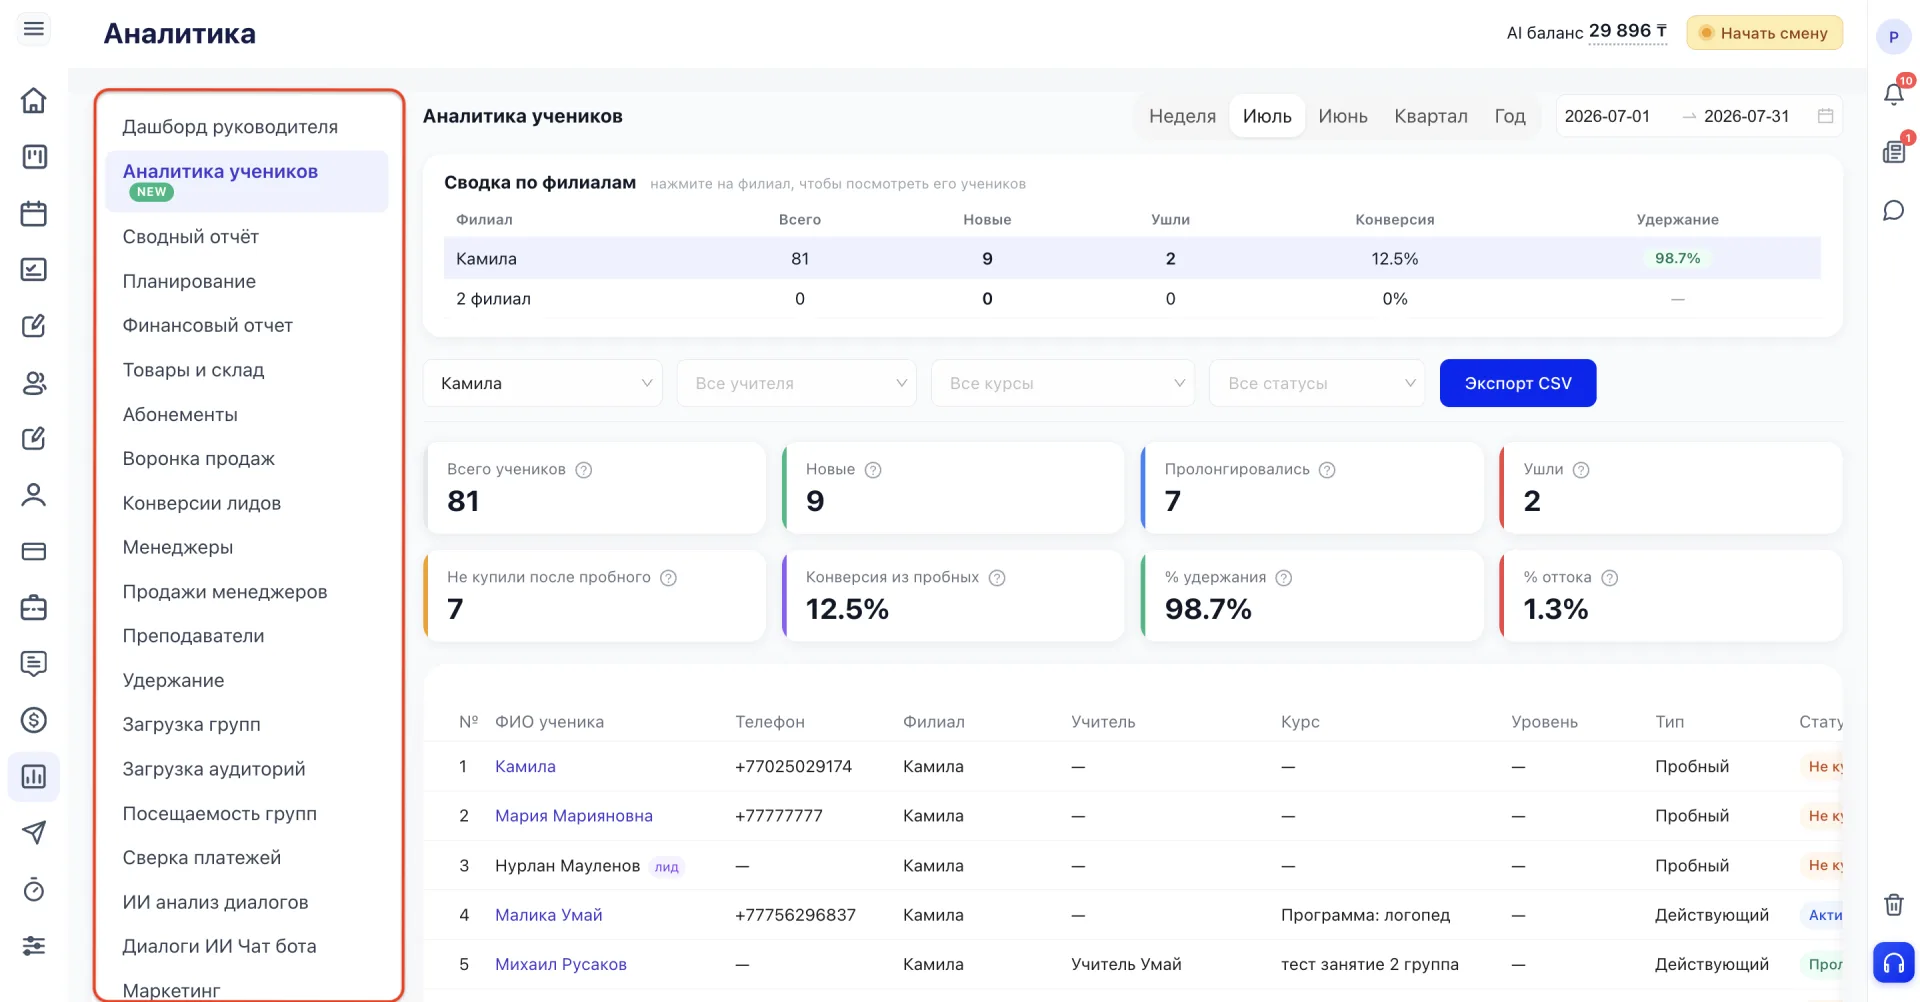
The section "Student Analytics (Аналитика учеников)" is located in Analytics, in the left sidebar menu.
2. Selecting the period
3. Summary by branches
4. Filters and export
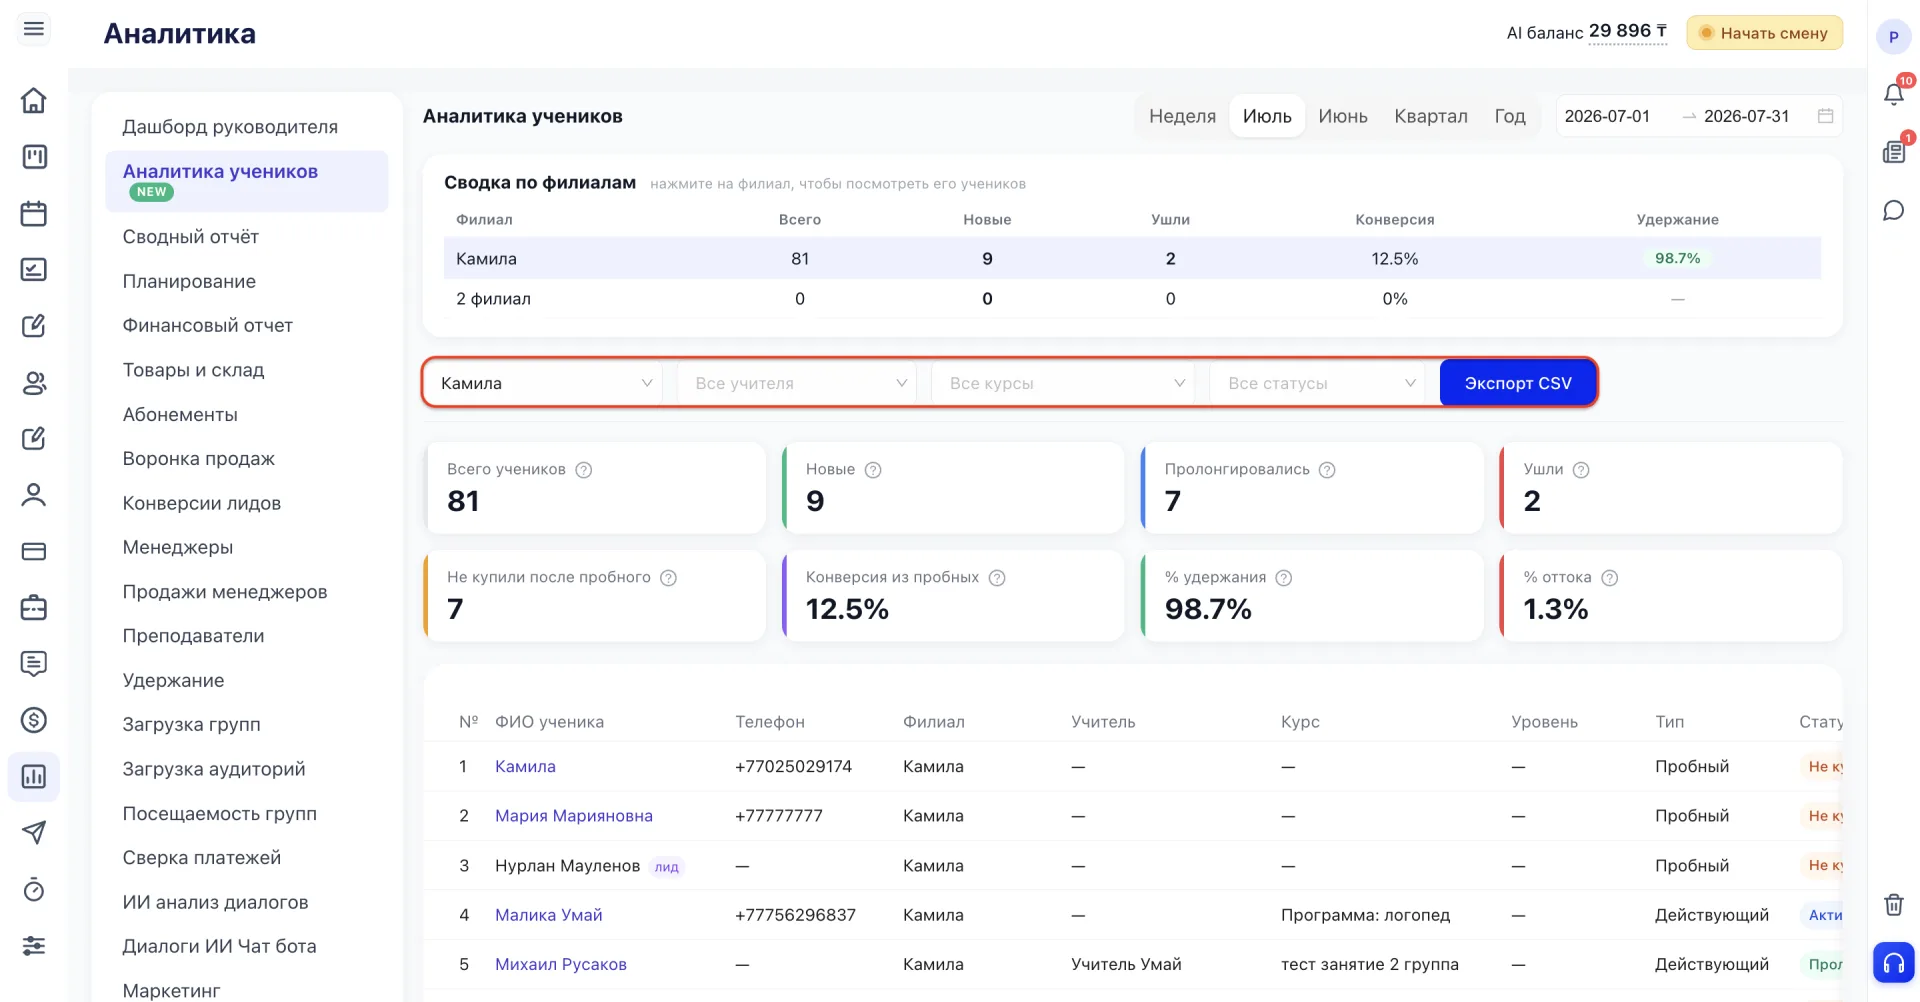
Data in the section can be narrowed using filters: by branch, by Teacher, by course, and by Student status. The "Export CSV" button exports the current table data to a file.
5. Key metrics
Below the filters are cards with key numerical metrics about Students for the selected period and considering the applied filters. Each card reflects one metric:
- Total Students — the number of active Students with a valid Membership at the end of the period. Trial visits and Students who returned after leaving are not included in this number.
- New — Students who purchased a Membership for the first time during the period. The value may be greater than the "Total Students" metric if the center opened recently or has high churn: some new Students may leave during the same period.
- Renewed — Students who purchased a Membership that is not their first during the period, i.e., continued their studies.
- Left — Students whose last Membership expired during the period and was not renewed. The metric is counted by the actual expiration date of the Membership, not by the archive mark.
- Did not buy after trial — Students who attended a trial Class during the period but did not purchase a paid Membership.
- Conversion from trials — the share of Students who attended a trial Class and eventually purchased a paid Membership.
- % retention — the share of Students who were active at the start of the period and remained active at its end. If there was no active Student group at the start of the period (for example, the center or branch has just opened), the metric is displayed as a dash.
- % churn — the measure opposite to retention: the share of Students who were active at the start of the period and ceased to be active by its end. As with retention, if there was no student group at the start of the period the metric is displayed as a dash.
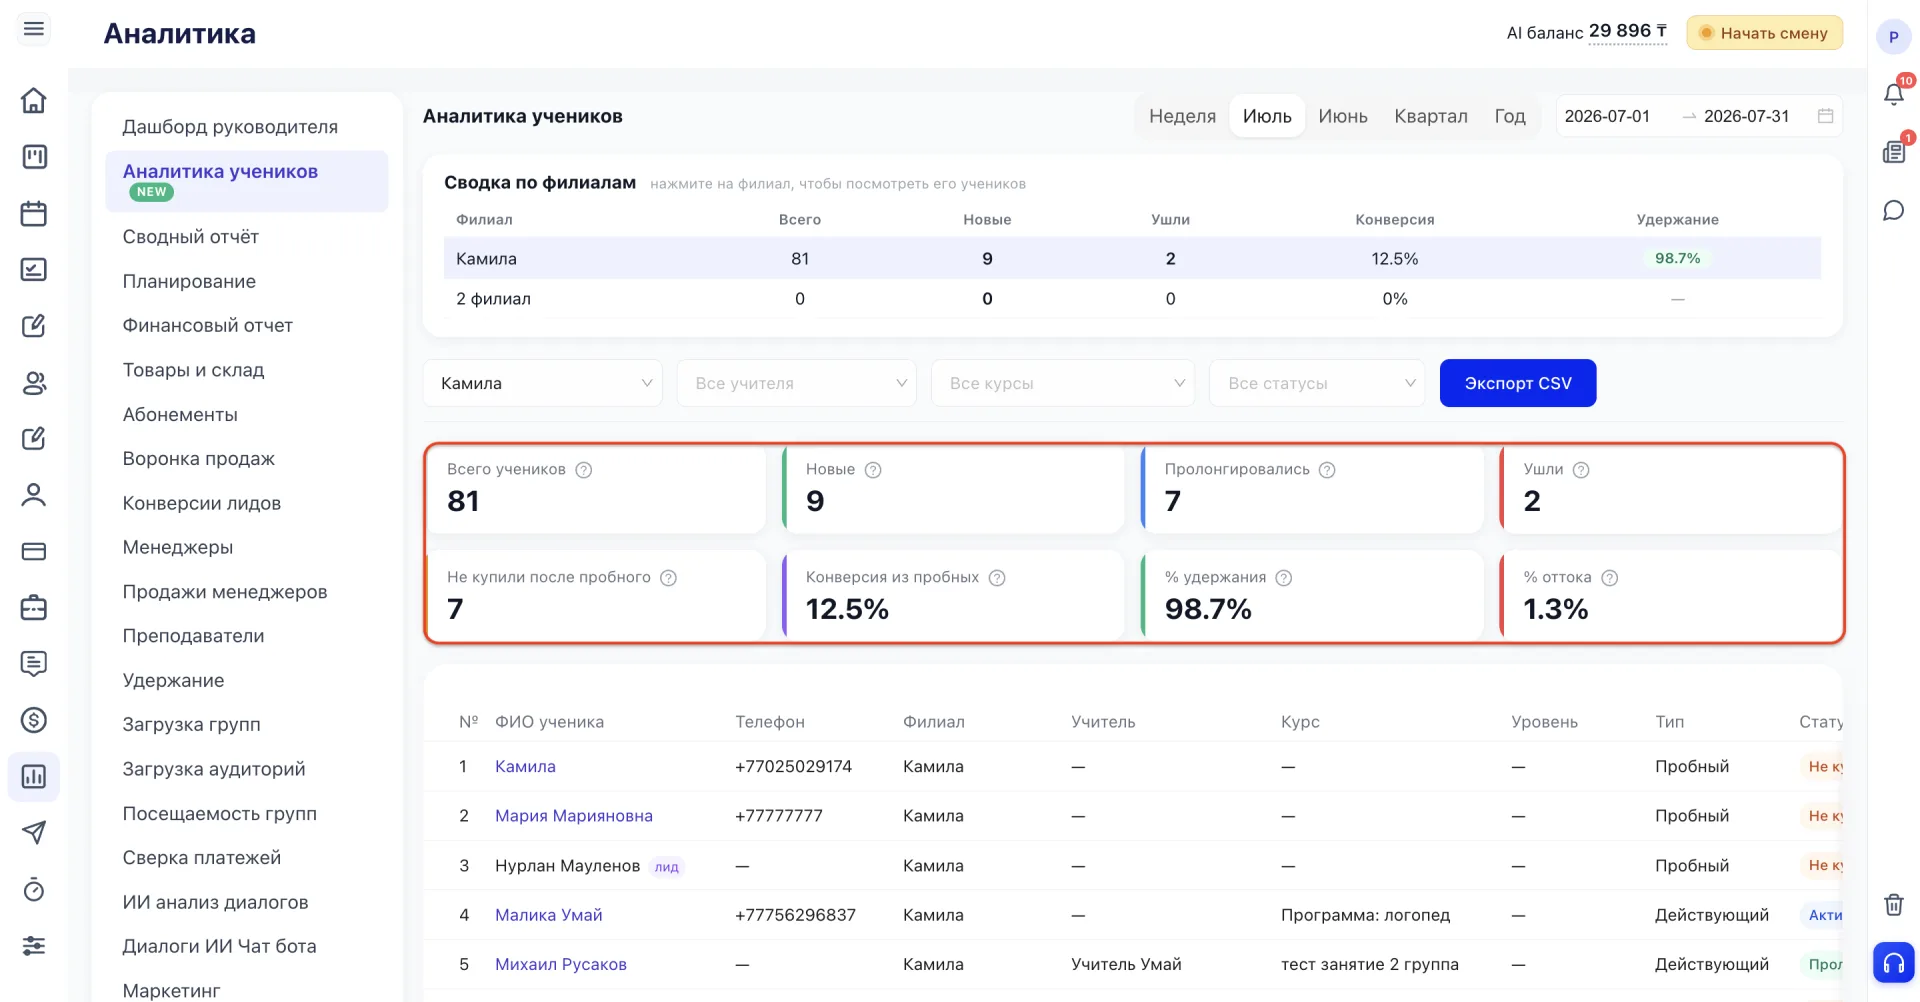
There is a tooltip icon next to the name of each metric: hovering over it shows the same definition directly in the interface.
6. Students table
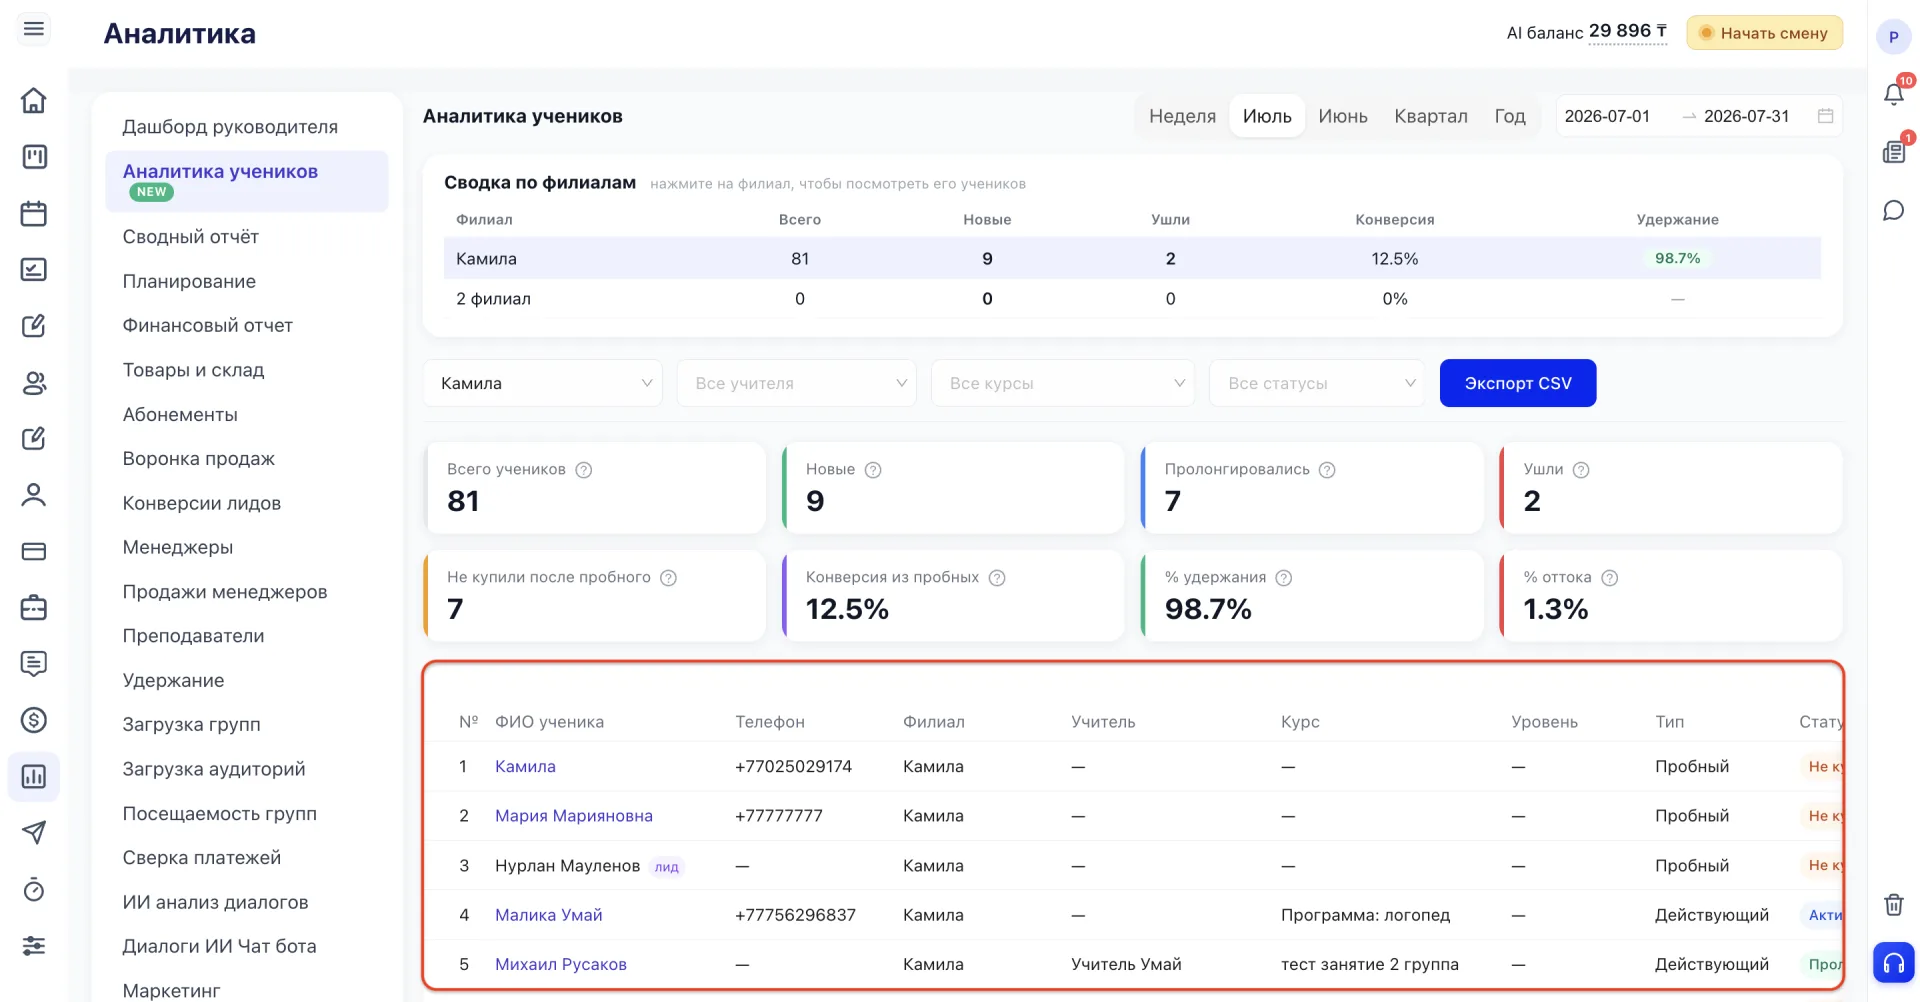
For each Student the following are shown:
- Full name - a clickable link that opens the Student card
- Phone - the Student's contact number
- Branch - the center to which the Student belongs
- Teacher - the Teacher who teaches the Student
- Course - the direction or program the Student is enrolled in
- Type - trial or active Student
- Status - for example, "Did not buy", "Active", "Renewed" or "Left"
- Trial date - date of the trial Class
- Purchase date - date of Membership purchase
- Start date - the start date of Classes under the Membership
- Leave date - the date when the Student ceased to be active
- Time studied - how long the Student studied at the center
- Reason for leaving / refusal - the stated reason if the Student left or refused to buy
- Bought after trial - indicates whether the Student purchased a Membership after the trial Class ("Yes" or "No")
- Membership amount - the cost of the purchased Membership
- Note - additional comment, for example the tag "Trial"
The full list of Students from the table can be exported to CSV via the filters if you need to move the data outside the CRM for further work.
7. How to read the metrics
Individual numbers rarely give a complete understanding of the situation. But considering the metrics together makes it easier to spot where problems arise and what requires attention.
Low conversion from trials. If Students rarely purchase a Membership after a trial Class, first determine where the problem occurs. Use filters by branch, Teacher, or course. If the metric differs only in one direction, pay attention to how trial Classes are conducted, how managers work with parents, and which refusal reasons occur most often.
High conversion from trials together with low retention. The trial Class goes well, Students buy a Membership, but after some time stop attending. In this case, check the "Reason for leaving / refusal" column in the Students table. If the same reason appears frequently, you will understand what to address first.
Growth in the "New" metric together with growth in the "Left" metric. An increase in new Students by itself is not always good news: if churn increases as well, the student base may stay the same rather than grow. Compare both metrics for the same period instead of looking at them separately.
Differences in metrics between branches. If you have multiple branches, compare them with each other. This will quickly show in which branch metrics differ from the others. This helps identify where to investigate causes and which processes require changes.
Important to note:
The table includes not only Students with a purchased Membership, but also those who only registered for a trial Class.
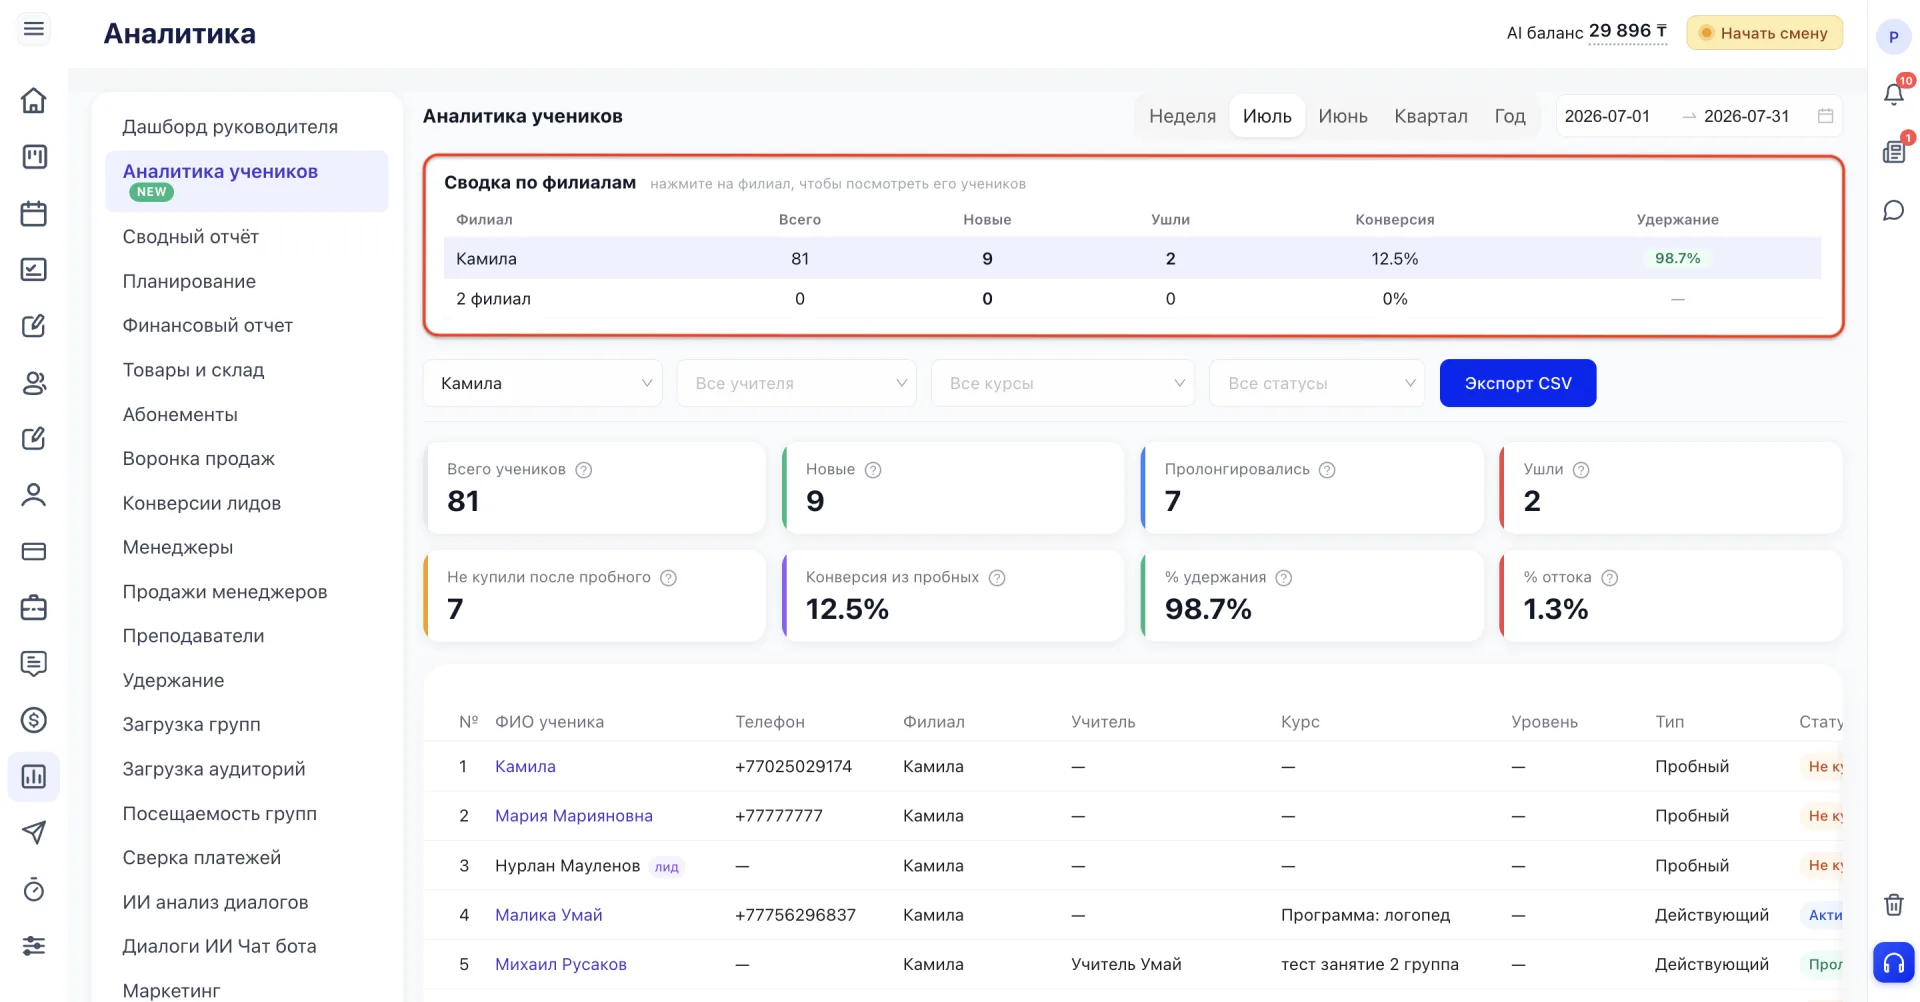
- All page blocks, except the summary by branches, are calculated taking into account the selected filters: when you change the branch, Teacher, course, status, or period the data updates simultaneously.
- The metrics "Left" and "Did not buy after trial" include only those whose event occurred during the selected period, not over the entire time.
- "% retention" and "% churn" are displayed as a dash if there were no active Students at the start of the period, for example for a new center or branch.