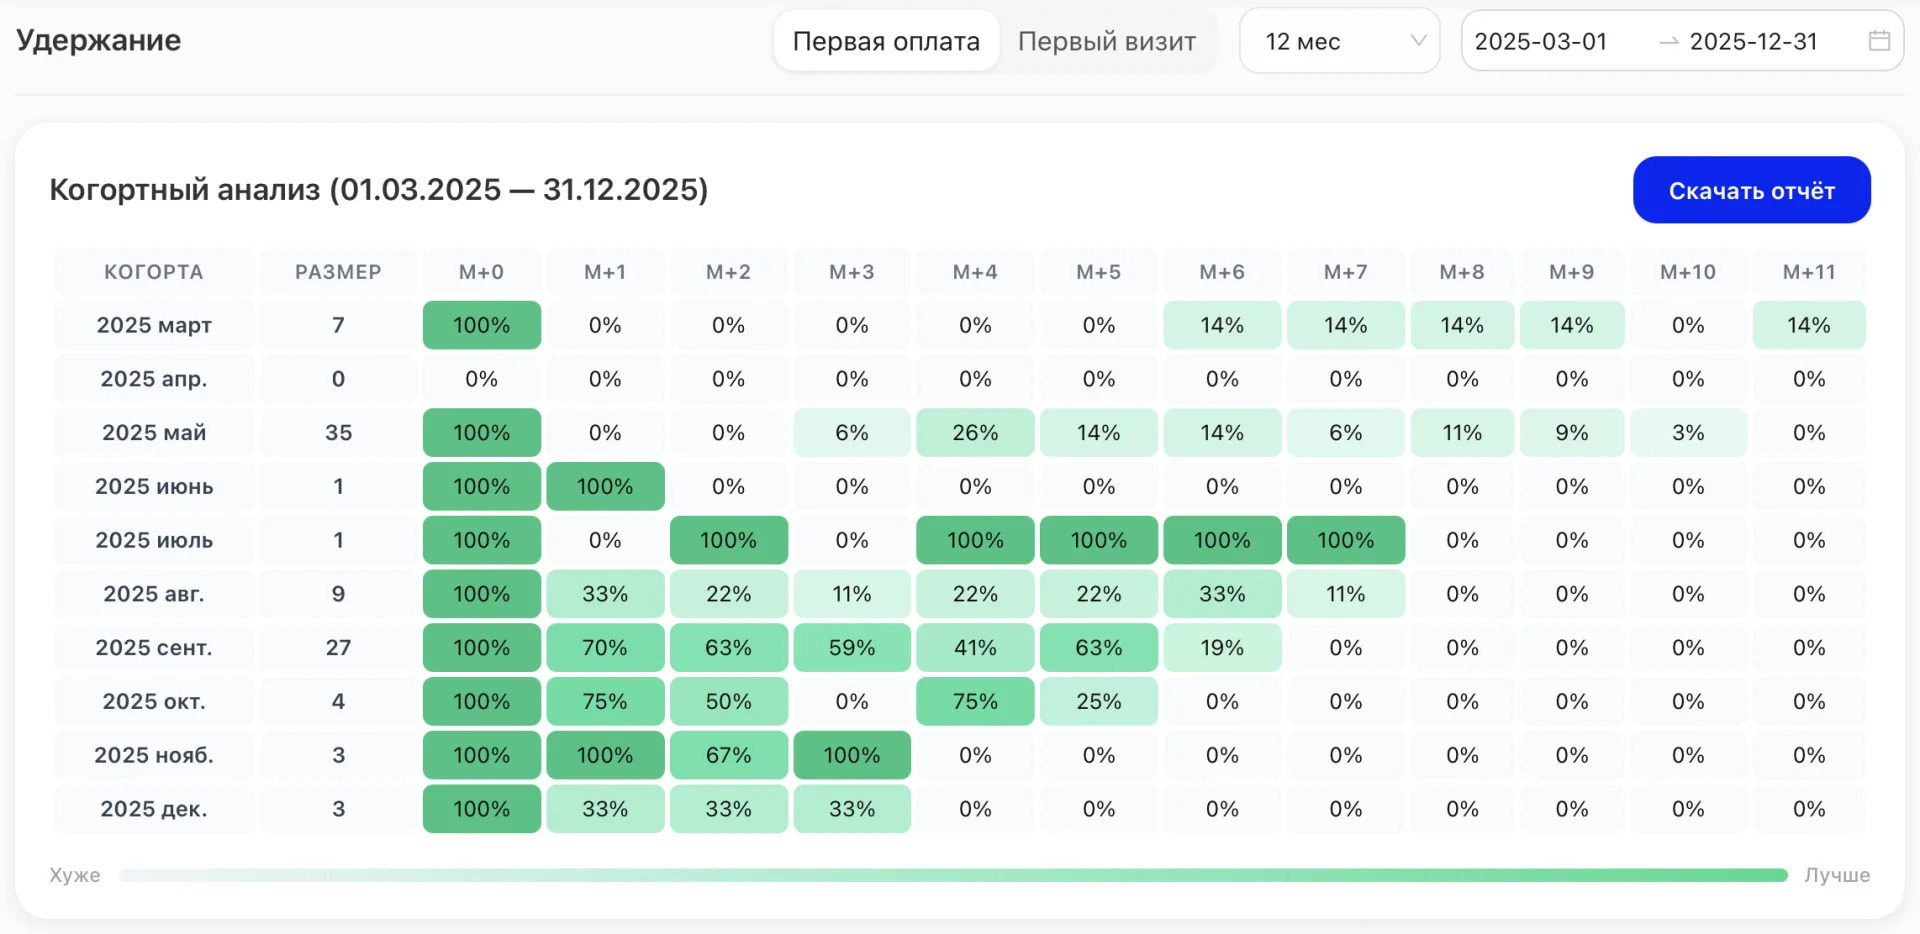
The report shows how clients stay with you after their first month of training. It helps you see not just the total number of Students, but how many of them continue over time.
Filter and button functionality:
- In the top panel you can choose whether to calculate cohorts by first Payment or first Visit.
- The dropdown is used to select the cohort length in months: 3, 6, 9, 12.
- Additionally, specific dates must be selected via the calendar.
- The report is available for download in CSV format.
Each cohort is a group of clients who started training in the same month.
How it works:
The first column shows the cohort — the start month.
For example,
"February
2026" — these are all clients who started training in
February.
The Size column shows how many people were in that group initially. This is the base from which percentages are then calculated.
Next come the columns M+0, M+1, M+2, etc.
Each of them shows how many of those same clients continued
training after a certain time:
- M+0 — how many of them were active in the start month.
- M+1 — how many remained one month after the start.
- M+2 — how many remained two months later.
- and so on.
Important: these columns count not new clients, but exactly the same people from the selected cohort.
For example:
In February 10 clients joined.
In M+0 — 100% (all started training).
In M+1 — 70% (7 people continued).
In M+2 — 50% (5 people remained).
Thus, for each row you can see what happens to that particular group of clients over time.
For easy perception, the table values are highlighted with colors:
- Green cells indicate
high retention — most clients continue training.
- Red — a decline
in activity, some clients have stopped coming.
This allows you to immediately see the "weak" months. For example, if in almost all rows the metric sharply drops at M+1, many clients do not reach the second month of training. This is a reason to check what happens after the first Membership: whether the client receives enough attention, whether the program is clear, and whether the Schedule is comfortable.
If values remain high at M+2, M+3 and beyond — it means clients stay for a long time. This is a good indicator of stability and quality of work.
What to pay attention to:
- Is there a sharp drop after the first month;
- Do the metrics differ across months (for example, in summer and fall);
- Does retention improve after changes in the center's operations;
- Are there recurring "weak" cohorts where clients leave more often.
Cohort analysis helps not just record churn, but understand when it occurs. This allows you to timely adjust processes and retain more clients, thereby increasing Income and the quality of the center's work.