The section helps track how effectively Groups are filled and make decisions about schedule planning and Student distribution.
1. Selecting the period
At the top of the section the period for Groups load is set: week, month, quarter, year, or a custom date range. After changing the period the chart rebuilds automatically.
For convenient analysis you can choose display by Groups or by Teachers, and save the report using the "Download report" button in the right part of the screen.
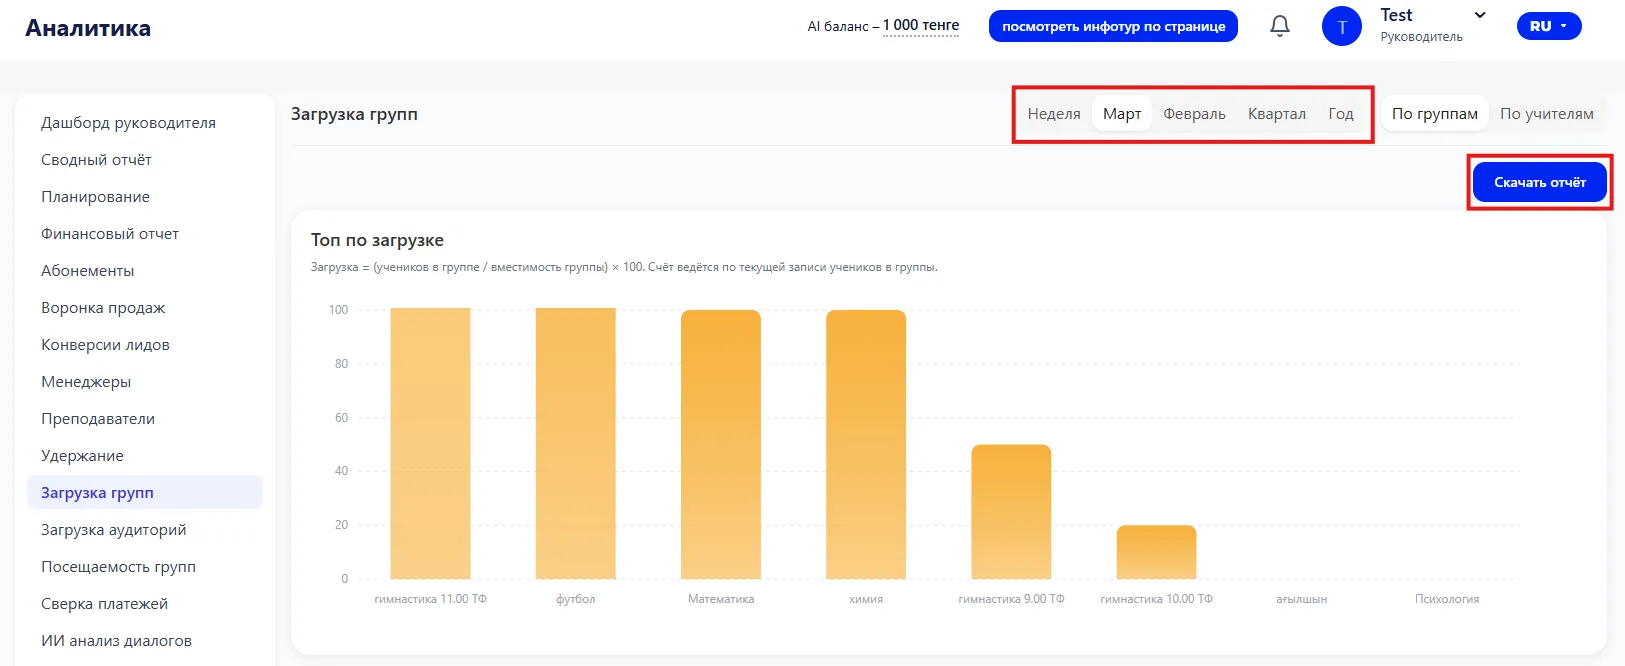
Different periods show different dynamics. A week helps notice current issues, a month allows seeing a stable trend, and a quarter gives the opportunity to assess systemic performance.
2. Top by load
The chart shows the Groups load for the selected interval:
- On the horizontal axis — names of Groups or Schedule of Classes;
- On the vertical axis — percentage of load, that is the ratio of the number of Students in a Group to its capacity, multiplied by 100%;
- Orange bars show the load level of each Group. The higher the bar, the more filled the Group is.
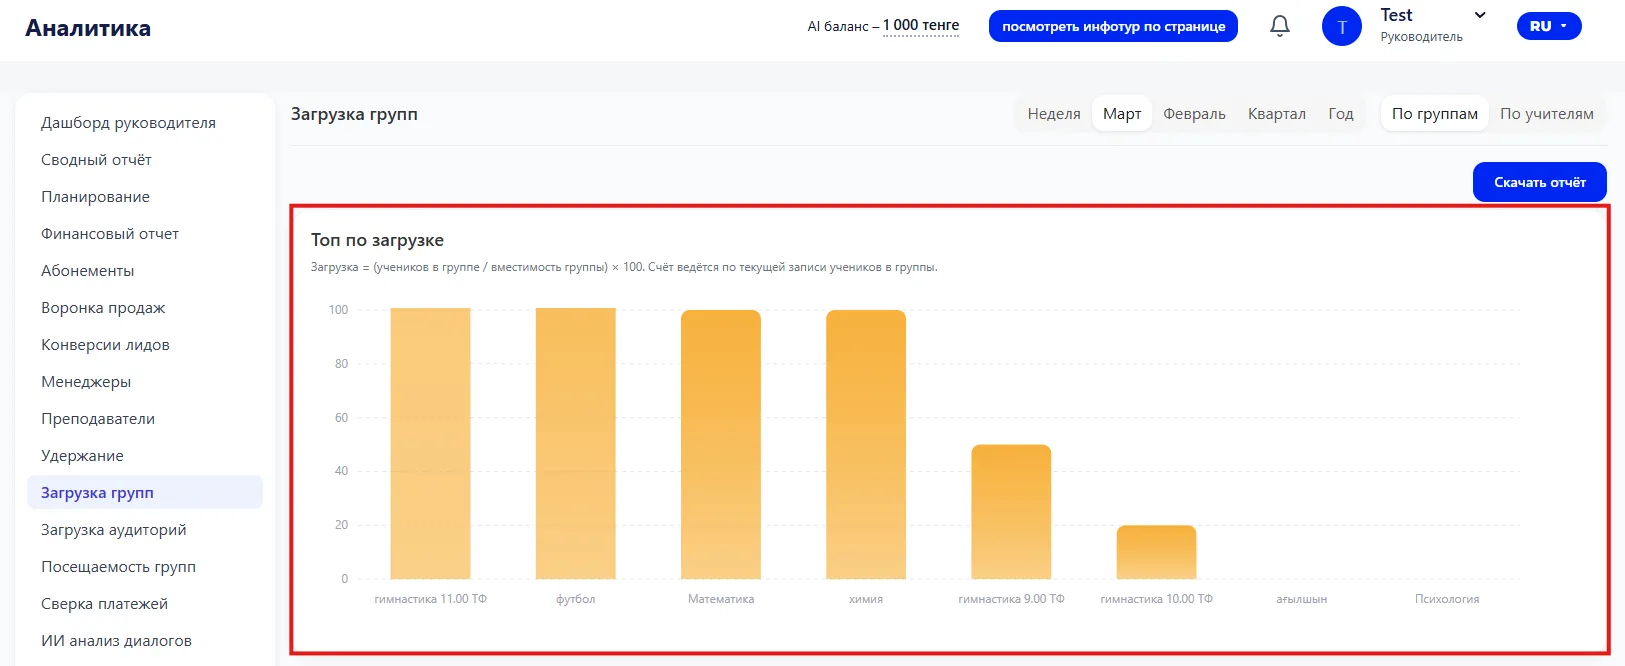
The chart helps quickly see which Groups are operating at full capacity and which have free seats. This is important for Schedule planning and effective distribution of Students.
3. Load details
Below is a table with detailed data for each Group:
- Item — name of the Group or Schedule;
- Students in group — current number of Students enrolled in the Group;
- Capacity — the maximum number of Students the Group can accept;
- Load, % — the ratio of Students to capacity, expressed as a percentage. If capacity is zero, the percentage is calculated based on the actual number of Students.
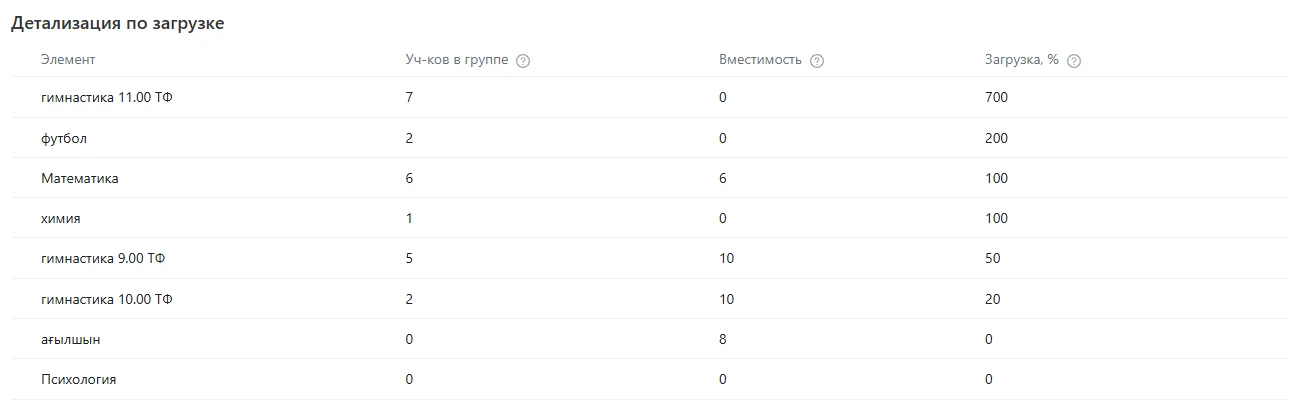
This data is needed to understand the real situation with Groups load and to identify Groups with overload or insufficient filling.
Recommendations:
- Pay attention to Groups with load close to 100% — it may be worth opening new Groups or increasing capacity;
- Groups with low load require analysis: reasons for low interest or scheduling problems;
- Use this information to balance workload among Teachers and improve Schedule planning;
- Download the report for further analysis or reporting.